
Figure 2: The effect of centering and scaling on a simple and tractable network of five genes:
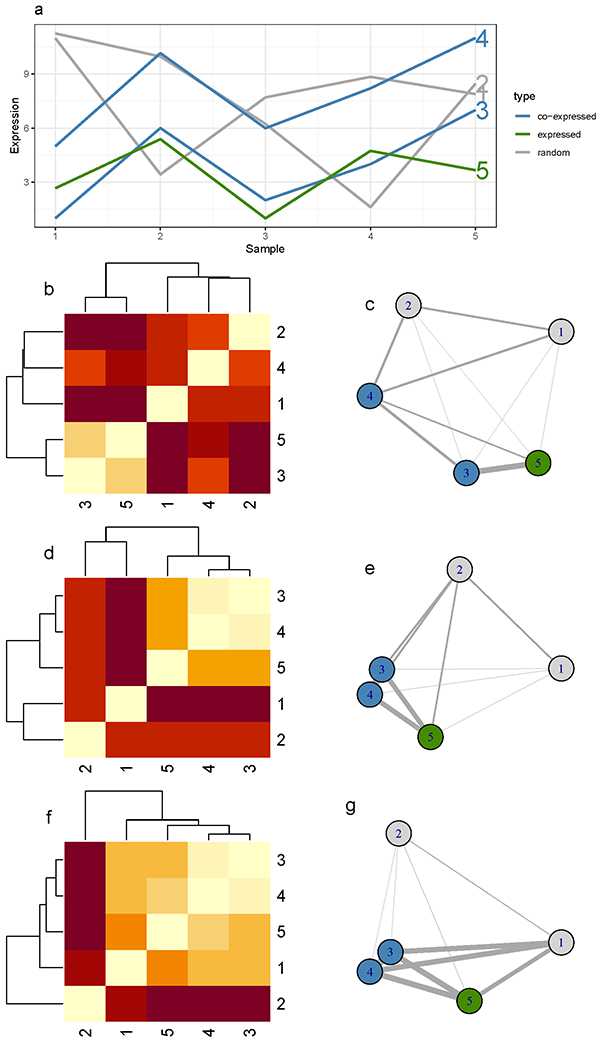
(a) genes 1 and 2 are random (in gray), genes 3 and 4 are co-expressed (in blue), and gene 5 (in green) has an expression close, in absolute expression intensity, to gene 3. The width of the graph edges and the layout of the graphs (c, e, f) (i.e., proximity of the nodes) are proportional to the similarity of the nodes/genes. Heatmap (b) and graph (c) represent the Euclidean distances and the resulting network, respectively, illustrating the similarity of genes 3 and 5 when the distances of absolute expression values are used. After centering and scaling of the expression values, we see how the co-expressed genes become closely connected (d, e). At the bottom (f, g), we represent the result of calculating gene expression correlation as a positive control, demonstrating the desired effect directly on the absolute expression values. The nodes of genes 3 and 4 nearly fully overlap.