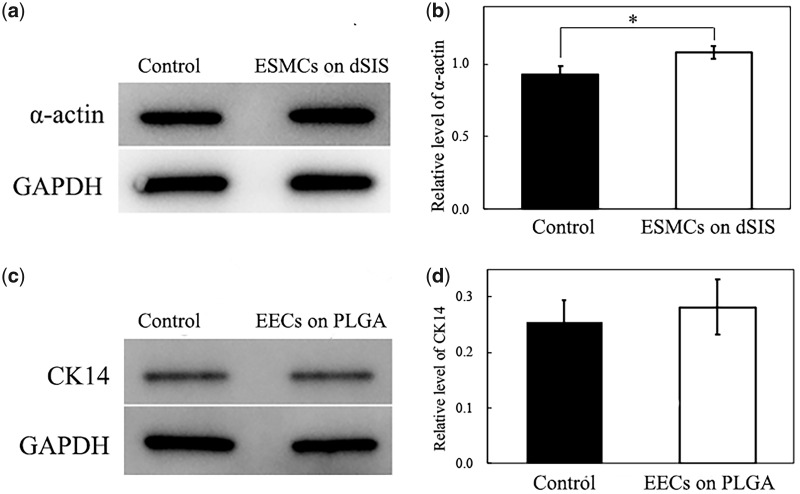
Figure 5.
Western blotting analysis of ESMCs and ECs on the scaffolds: (a) Western blotting bands of α-actin and GAPDH of ESMCs on the dSIS side of scaffold and in control group. (b) Normalized intensities of α-actin bands. (c) Western blotting bands of CK-14 and GAPDH of EECs on the PLGA side of scaffold and in control group. (d) Normalized intensities of CK-14 bands. *P < 0.05.

