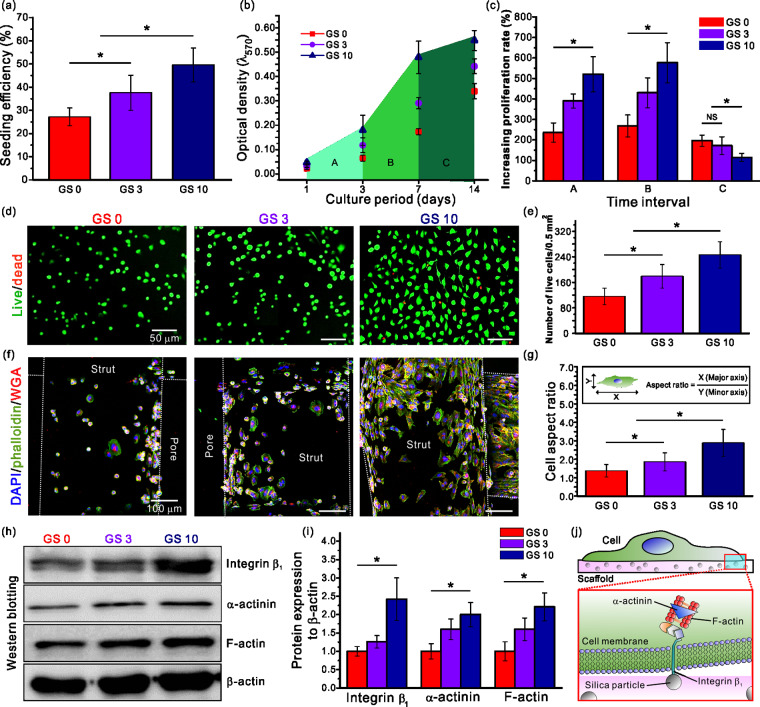
Figure 5.
(a) Cell seeding efficiency of the hMSCs on the scaffolds after 4 h. (b) Cell proliferation results for 1, 3, 7 and 14 days and (c) the cell proliferation rate at different time intervals (A, B and C). (d) Live/dead images of the scaffolds after 24 h and the corresponding (e) results of the viable cell number. (f) DAPI/phalloidin/WGA images after 24 h and (g) the cell aspect ratio results. (h, i) Relative protein expression of integrin β1, α-actinin and F-actin. (j) Schematic showing the mechanism of signaling pathway.

