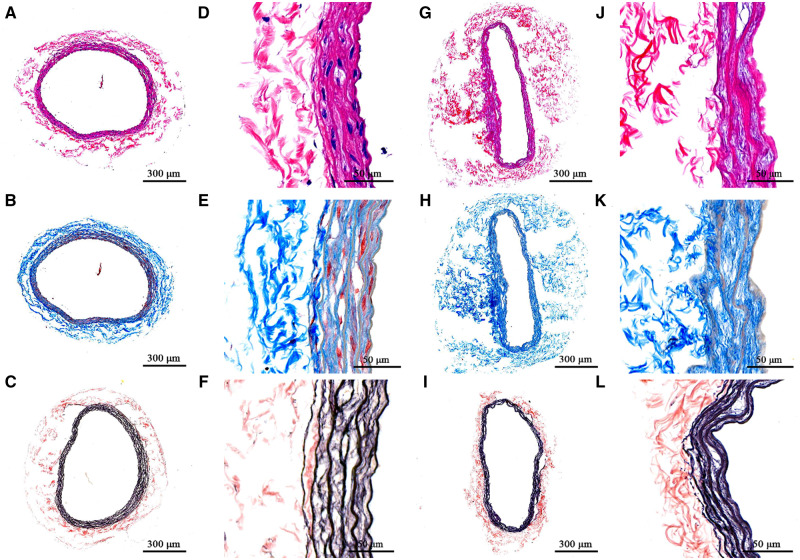
Figure 2.
Histological results of native and decellularized. HE staining results of arteries before (A and B) and after decellularization (G and J). Masson staining results of arteries before (B and E) and after decellularization (H and K). Diphenol staining results of arteries before (C and F) and after decellularization (I and L). The scale bars in the images were 300 µm

