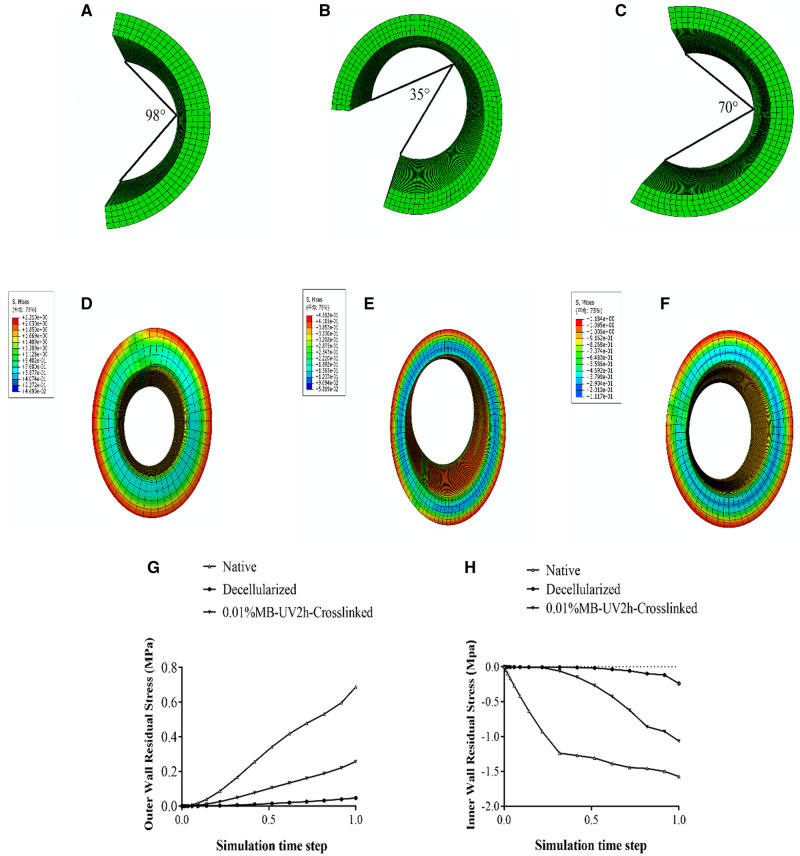
Figure 8.
Results of finite element numerical simulation for residual stress. (A), (B) and (C) represent the average opening angle model of the native, decellularized and 0.01%MB-UV2h-crosslinked arteries. (D), (E) and (F) represent residual stress of the native, decellularized and 0.01%MB-UV2h-crosslinked arteries. (G) and (H) represent changes in residual stress of outer and inner wall among the native, decellularized and 0.01%MB-UV2h-crosslinked arteries during the whole finite element simulation process

