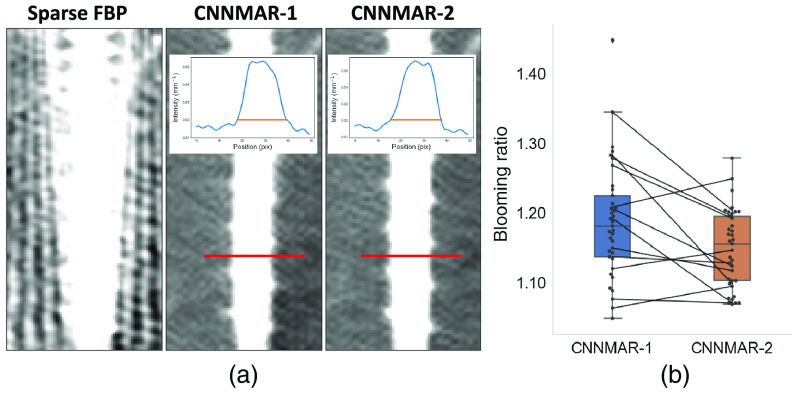
Fig. 11.
Blooming ratio evaluation of CNNMAR methods applied on sparse scans with simulated polyenergetic screws. (a) Exemplary images with Sparse FBP reference and CNNMAR-1 and CNNMAR-2 outputs. Red lines depict an exemplary cross-section for evaluation the screw diameter, with the inset plots showing line profiles with the diameter computed using the full width at 20% of the maximum. (b) Boxplots depict the distribution of the blooming ration among the dataset for both CNNMAR methods.

