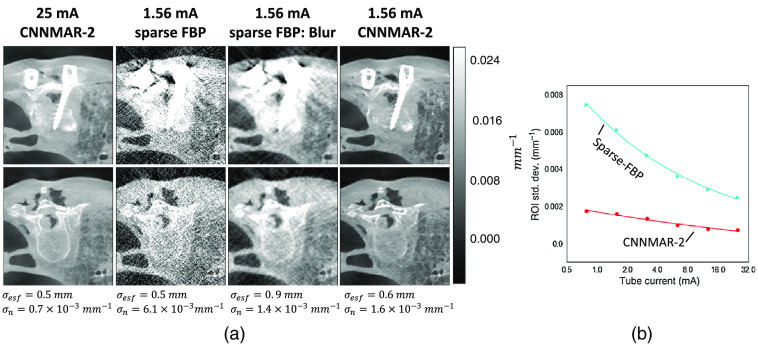
Fig. 12.
Evaluation of CNNMAR-2 at reduced tube current. (a) Visualization of CNNMAR-2 performance at 1/16th the nominal tube current. Top and bottom rows depict two nearby axial slices. Columns from left to right show CNNMAR-2 at 25 mA, Sparse FBP at 1.56 mA, Sparse FBP at 1.56 mA with Gaussian blur, and CNNMAR-2 and 1.56 mA. Below each column show the measured ESF width noise standard deviation. (b) Plot of the tube current vs. noise standard deviation for CNNMAR-2 and Sparse FBP.

