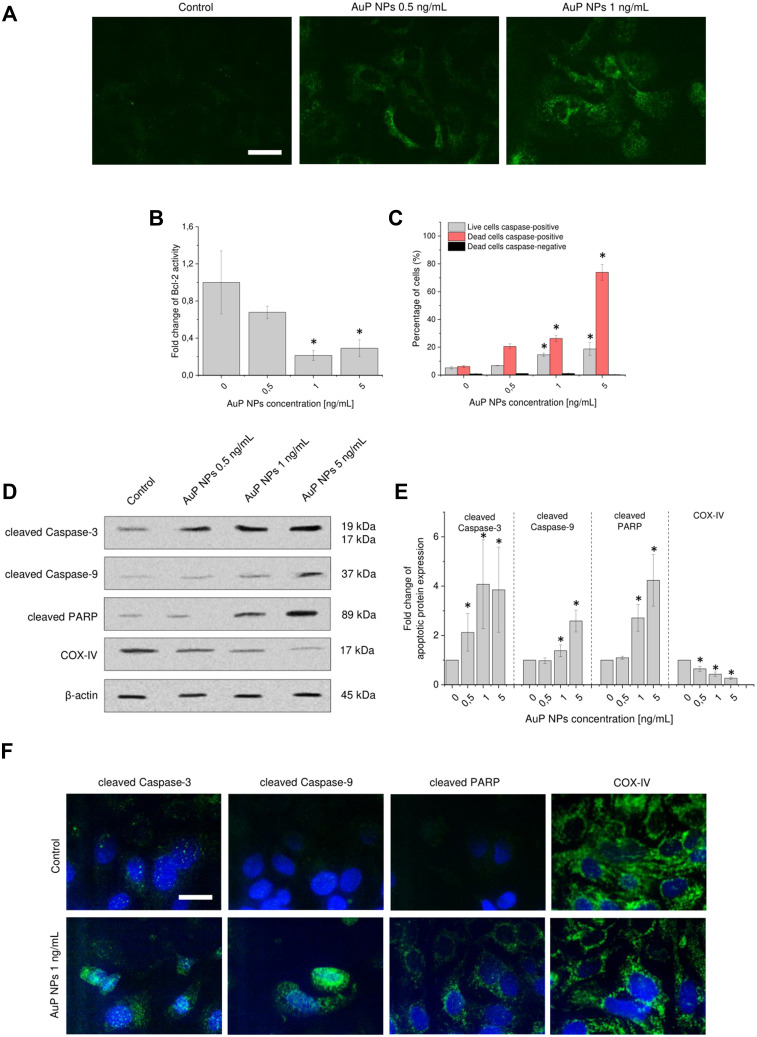
Figure 5.
Mechanism of AuP NPs-induced apoptosis of ovarian cancer cells. Immunostaining of Annexin 1 (A), decrease of anti-apoptotic protein Blc-2 activity (B) and increase of number of caspase-positive cells (C) in AuP NPs-treated ovarian cancer cells. Western blot measurements of apoptotic proteins’ expression: cleaved-Caspase-3, cleaved-Caspase-9, cleaved-PARP, and cytochrome C oxidase subunit 4 isoform 1 (COX-IV) in AuP NPs-treated cancer cells. Representative blots and densitometry analysis are presented in (D) and (E), respectively. (F) The immunofluorescence images of ovarian cancer cells treated with AuP NPs when compared to untreated controls. Blue color indicates fluorescence of Hoechst 33,342 – nucleic acid staining, while green color -FITC or -AlexaFluor 488 – proteins staining. Scale bar ~10 µm. For panels (A, D, and F) representative results are presented. For panels (B, C, and E) results are presented as mean±SD from three independent experiments. *Statistical significance (P<0.05) when compared to untreated control cells.

