. 2021 Mar 4;10:e64691. doi: 10.7554/eLife.64691

Figure 2. R1021C and R1021P mutations in p110γ are destabilising, with R1021P leading to global destabilisation and R1021C leading to localised disruption of the C-terminal regulatory W1080 Tryptophan ‘lock’.

(A+B) Peptides showing significant deuterium exchange differences (>5%,>0.4 kDa and p<0.01 in an unpaired two-tailed t-test) between wild-type and R1021C (A) and wild-type and R1021P (B) p110γ/p101 complexes are coloured on a model of p110γ (PDB: 6AUD)(Safina et al., 2017). Differences in exchange are coloured according to the legend. (C+D) The number of deuteron difference for the R1021C and R1021P mutants for all peptides analysed over the entire deuterium exchange time course for p110γ. Every point represents the central residue of an individual peptide. The domain location is noted above the primary sequence. A cartoon model of the p110γ structural model is shown according to the legend in panels A+B. Error is shown as standard deviation (n = 3). (E+F) The number of deuteron difference for the R1021C and R1021P mutants for all peptides analysed over the entire deuterium exchange time course for p101. Every point represents the central residue of an individual peptide. Error is shown as standard deviation (n = 3). (G) Selected p110γ peptides that showed decreases and increases in exchange are shown. The HDExaminer output data and the full list of all peptides and their deuterium incorporation is shown in the Figure 2—source data 1 file.

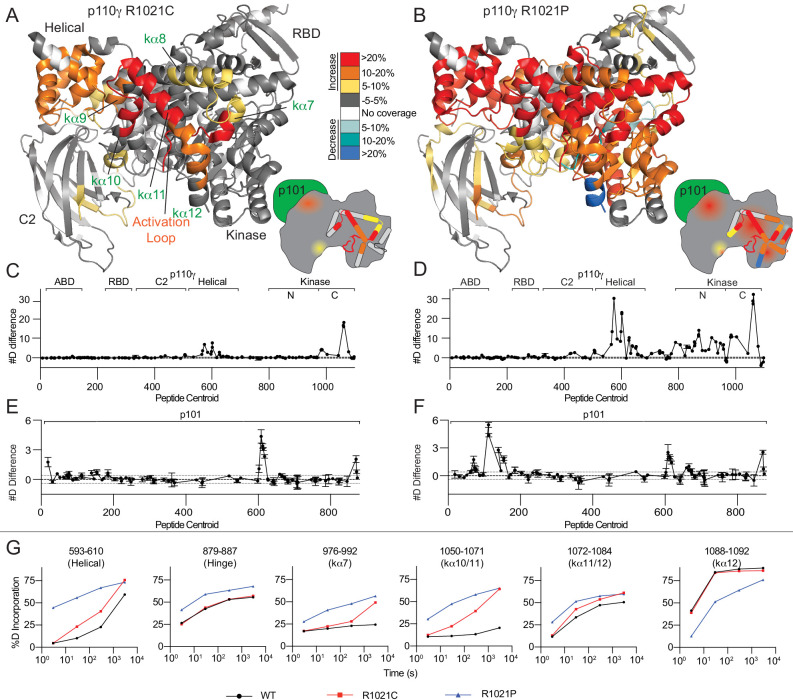
Figure 2—source data 1. Source data for HDX-MS comparing p110g/p101 and mutants.
elife-64691-fig2-data1.xlsx (982.5KB, xlsx)

Figure 2.

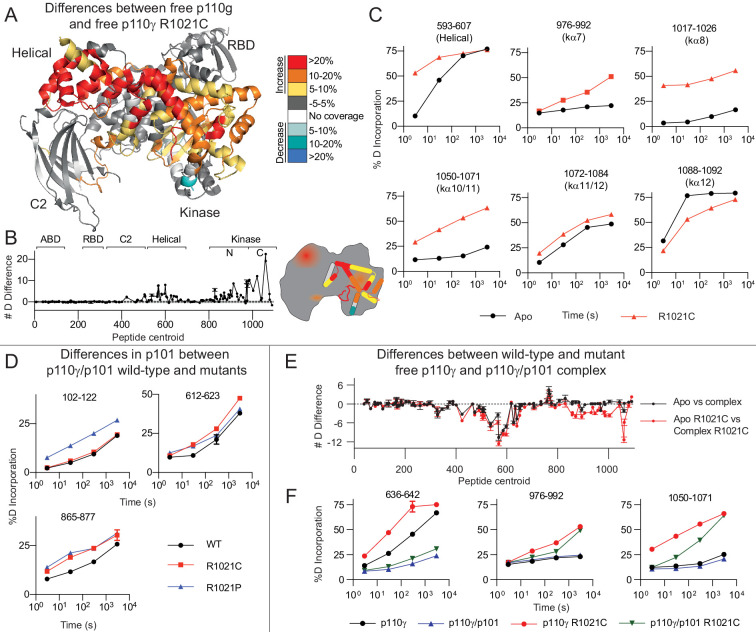
Figure 2—figure supplement 1. Differences in HDX for the R1021C mutation in free p110γ.

Figure 2—figure supplement 1.

(A) Peptides showing significant deuterium exchange differences (>5%,>0.4 kDa and p<0.01 in an unpaired two-tailed t-test) between p110γ wild-type and R1021C. Differences are coloured on a model of p110γ (PDB: 6AUD). (B) The number of deuteron difference for the R1021C mutant for all peptides analysed over the entire deuterium exchange time course for p110γ. (C) Selected p110γ peptides that showed significant decreases and increases in exchange are shown (>5%, >0.4 kDa and p<0.01 in an unpaired two-tailed t-test). (D) Selected p101 peptides that showed differences in exchange (>5%, >0.4 kDa and p<0.01 in an unpaired two-tailed t-test) are shown. (E) The number of deuteron difference between free p110γ and p110γ/p101 (black) and free p110γ R1021C and p110γ/p101 R1021C (red) for all peptides analysed over the entire deuterium time course for p110γ. The HDExaminer output data and the full list of all peptides and their deuterium incorporation is shown in the Figure 2—figure supplement 1—source data 1 file. (F) Selected p110γ peptides from experiments comparing wild-type p110γ and p110γ R1021C, and wild-type p110γ/p101 and p110γ/p101 R1021C. The full list of all peptides and their deuterium incorporation is shown in Source Data.
Figure 2—figure supplement 1—source data 1. Source data for HDX-MS comparing free p110g and free p110g R1021C.