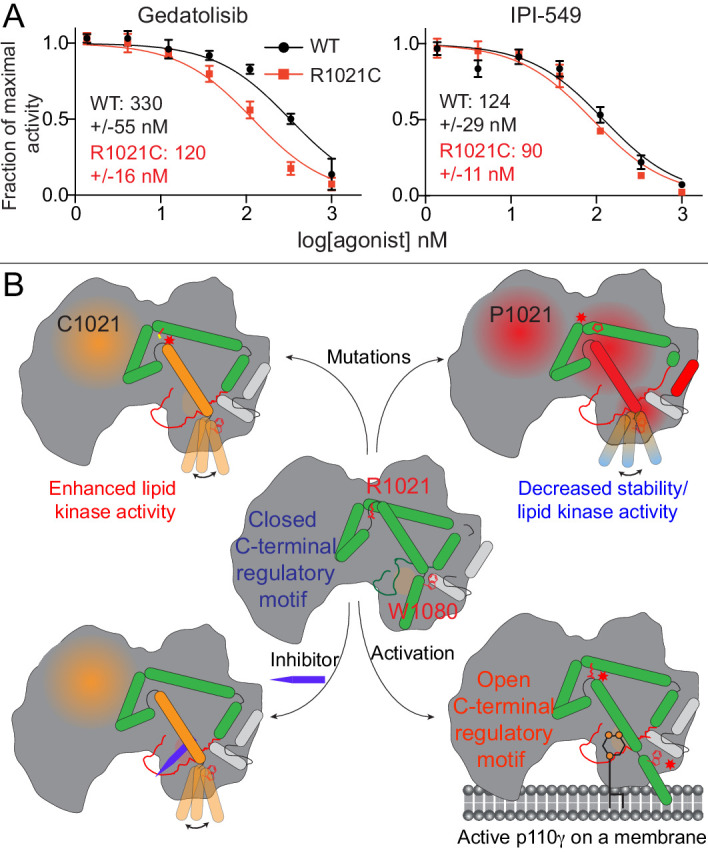
Figure 6. Activating mutations show slight differences in inhibition by allosteric inhibitors and model of PI3Kγ regulation.

(A) IC50 curves for wild-type and R1021C p110γ/p101 complexes. Assays were carried out with 5% C8 PIP2/95% PS vesicles at a final concentration of 1 mg/ml in the presence of 100 μM ATP and 1.5 μM lipidated Gβγ. PI3Kγ concentration was 4 nM for R1021C and 8 nM for WT. Error is shown as standard deviation (n = 3). Refer to the Figure 6—source data 1 file for IC50 curve data. (B) Model of conformational changes that occur upon mutation of the C-terminal motif and binding of activation loop interacting conformation selective inhibitors.
