
Figure 4:
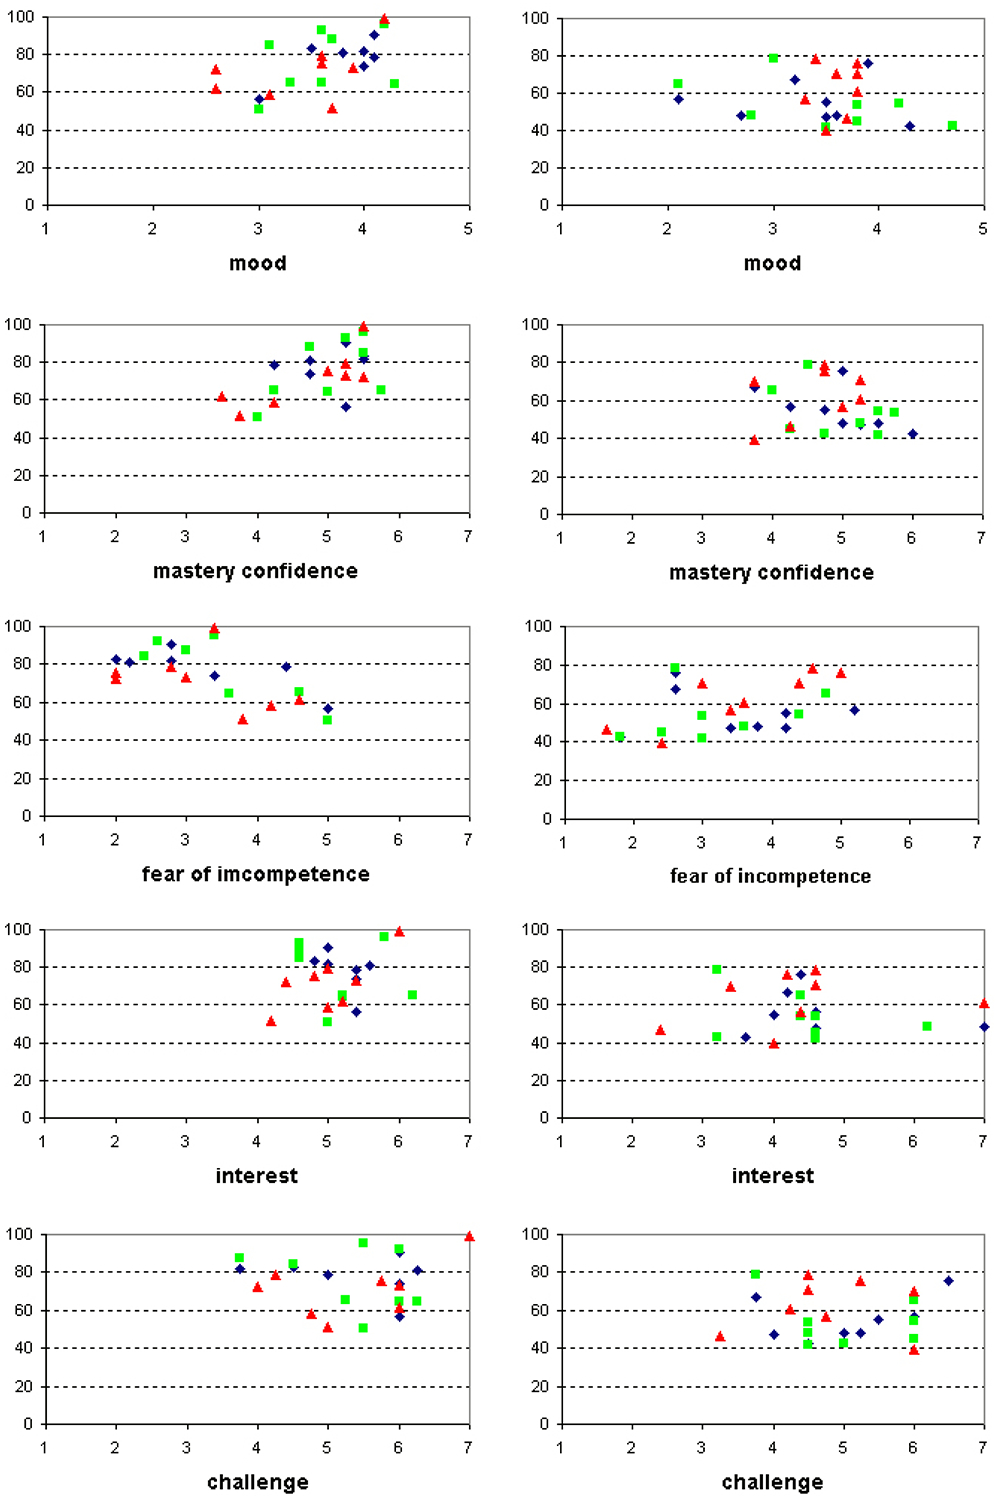
From top to bottom performance is plotted against mood, mastery confidence, fear of incompetence, interest and challenge. Left column: data from the visual feedback group, right column: auditory feedback group. Diamonds represent the ratings prior to session one, triangles prior to session two and squares prior to session three.