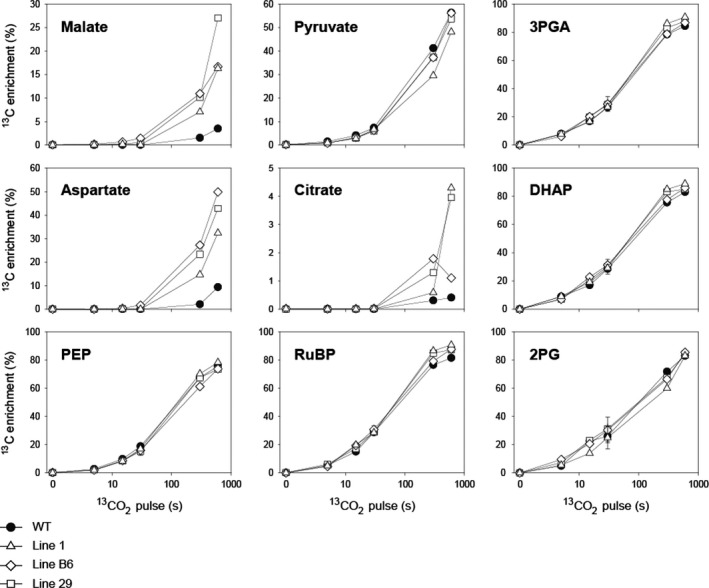
Figure 2.

13C enrichment (%) during 13CO2‐pulse labelling of wild‐type (WT) rice and three transgenic lines expressing enzymes of the C4 metabolic pathway. 3PGA, 3‐phosphoglycerate; DHAP, dihydroxyacetone phosphate; PEP, phosphoenolpyruvate; RuBP, ribulose‐1,5‐bisphosphate; 2PG, 2‐phosphoglycolate. The x‐axes show the pulse labelling time on a log scale. Values from the 30 s time point are mean ± SD, n = 3‐4 biological replicates. Values at all other time points are from individual samples or means of two biological replicates. Abundances of individual isotopomers are shown in Figure 3 and Figure S9. The original data are presented in Data S1.
