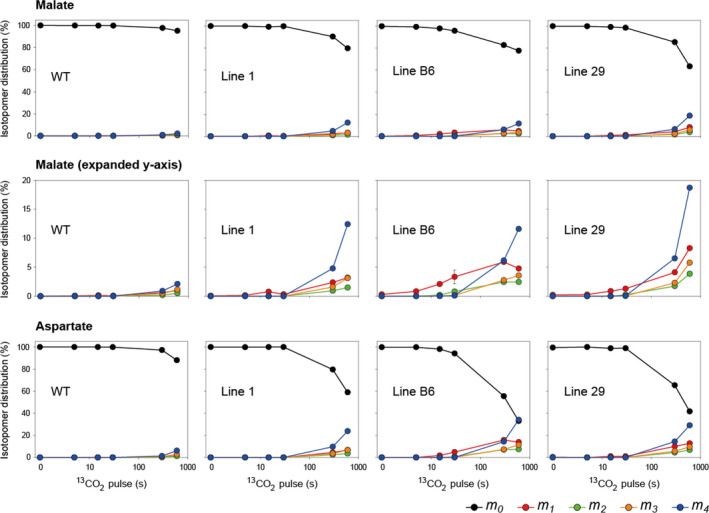
Figure 3.

Isotopomer distribution (%) of malate and aspartate during 13CO2‐pulse labelling of wild‐type (WT) rice and three transgenic lines expressing enzymes of the C4 metabolic pathway. The relative abundance of each isotopomer (mn) for a given metabolite is represented, where n is the number of 13C atoms incorporated. The x‐axes show the pulse labelling time on a log scale. Values from the 30 s time point are mean ± SD, n = 3‐4 biological replicates. Values at all other time points are from individual samples or means of two biological replicates. Isotopomer abundances for further metabolites are shown in Figure S9. The original data are presented in Data S1.
