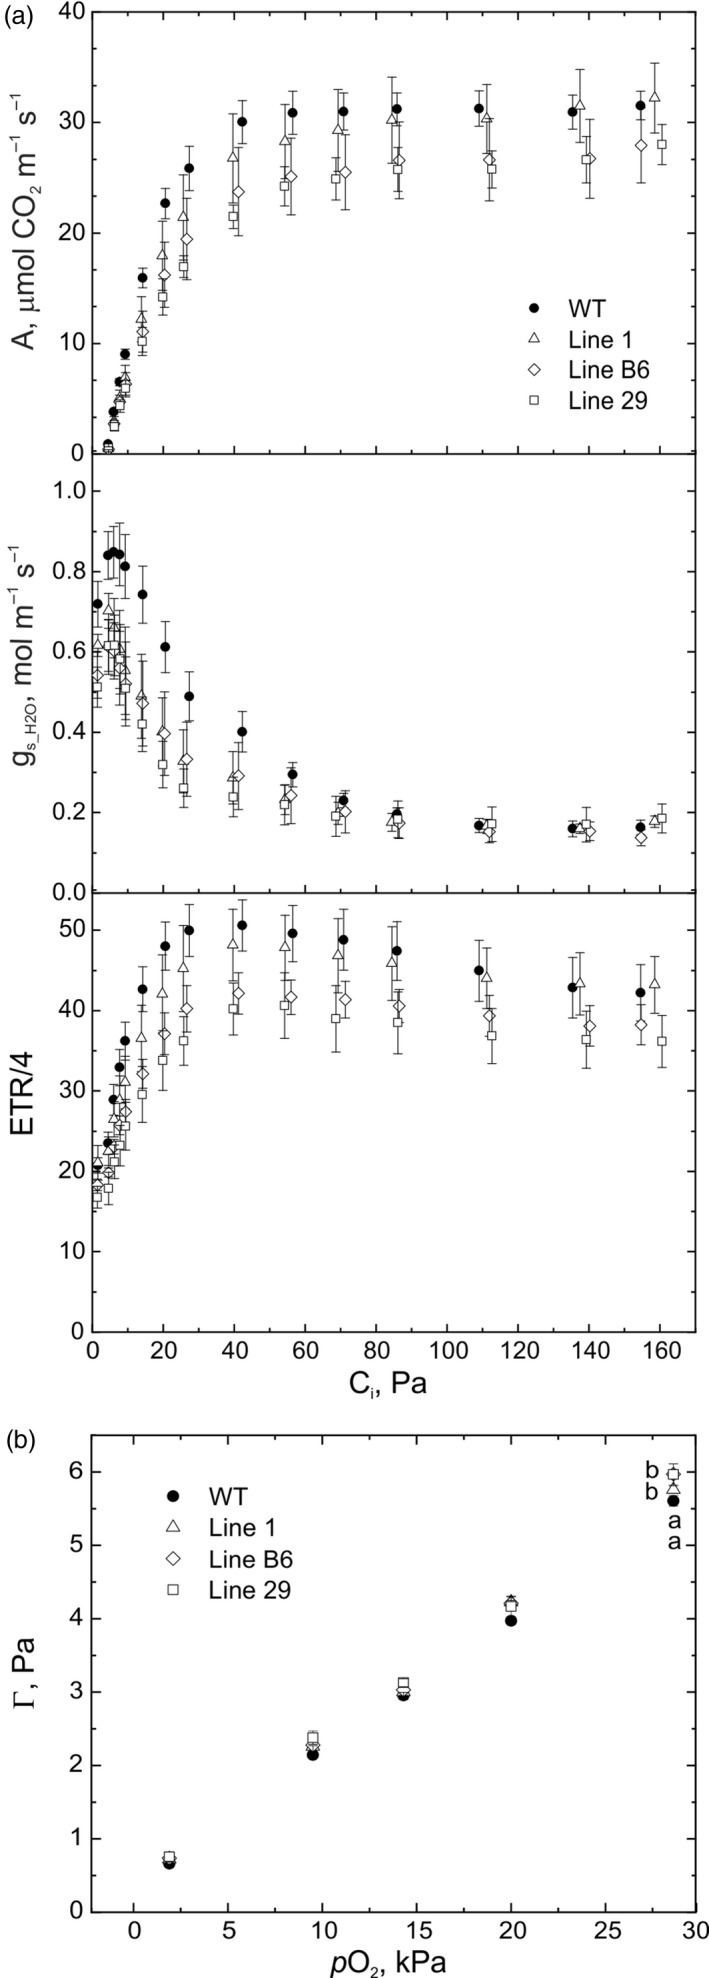
Figure 4.

Gas‐exchange and fluorescence analysis of wild‐type (WT) O. sativa and three transgenic lines expressing enzymes of the C4 metabolic pathway. (a) A, net CO2 assimilation rate; gs_H2O, leaf stomatal conductance to water vapour; ETR/4, light‐driven electron transport rate through PHotosystem II divided to four, measured at different intercellular pCO2 (Ci), PPFD of 1500 µmol m‐2 s‐1 and ambient pO2 (20 kPa). Parameters determined by fitting the A‐Ci response curves and statistical analysis are provided in Table 2. (b) Leaf CO2 compensation point (Г). Mean ± SE, n = 5 biological replicates for WT, n = 4 otherwise. Statistical analysis was performed using one‐way ANOVA and Tukey’s post hoc test, letters indicate significant differences between the groups (α > 0.05) .
