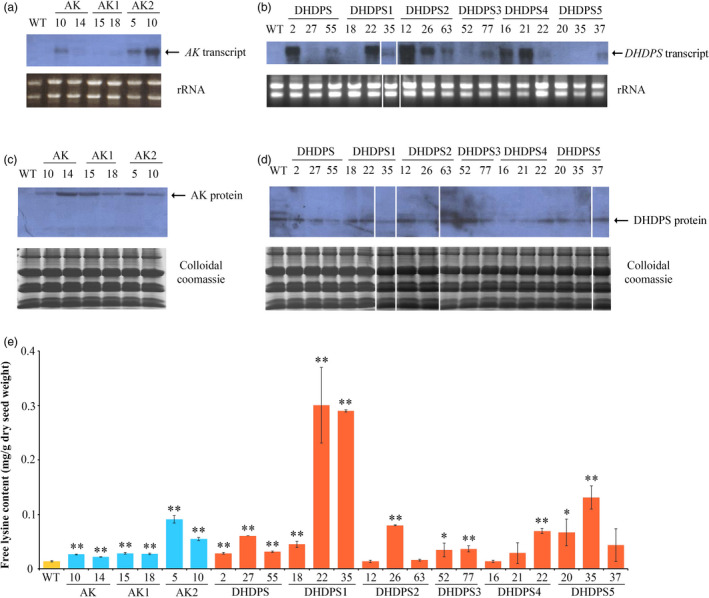
Figure 2.

AK and DHDPS expression in developing rice seeds, and free lysine content in monofactorial transgenic and WT rice. (a, b) Northern blot analyses of rice AK and DHDPS expression in 15 DAF developing seeds. (c, d) Western blot analyses of rice AK and DHDPS expression in 15 DAF developing seeds. (e) Free lysine content (mg/g dry seed weight) in modified and unmodified AK and DHDPS transgenic and WT rice. Error bars represent SD for three biological replicates, and * and ** indicate significant difference between transgenic and WT plants with P < 0.05 and P < 0.01, respectively. The white lines represent the images from discontinuous lanes in a film or different films.
