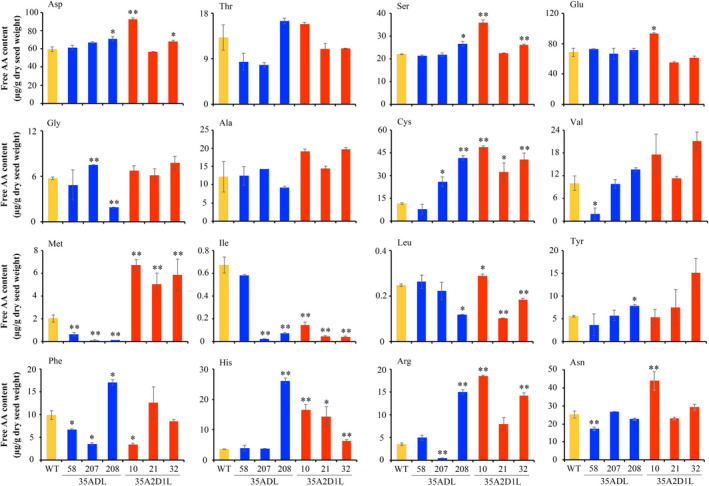
Figure 5.

The content of other measurable free amino acids in mature seeds of transgenic and WT rice. Data are presented as μg/g dry seed weight. Error bars represent SD of three biological replicates, and * and ** indicate significant difference between transgenic and WT plants with P < 0.05 and P < 0.01, respectively.
