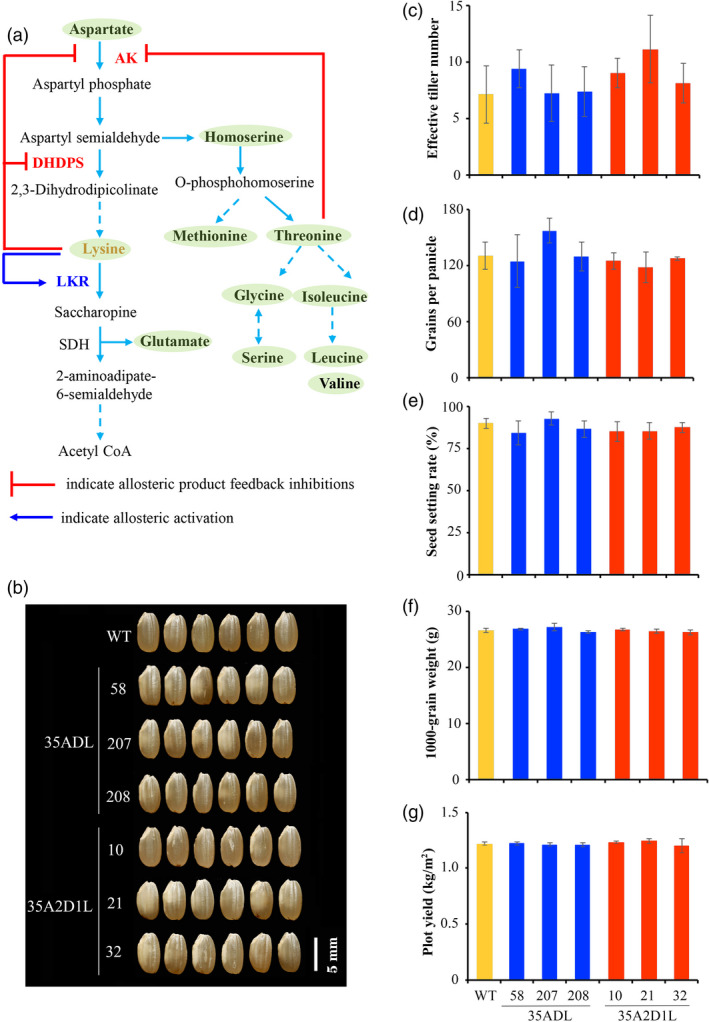
Figure 6.

Major agronomic traits and appearance of mature seeds from transgenic and WT rice. (a) Aspartate‐derived lysine metabolism pathway in higher plants. The red lines indicate allosteric product feedback inhibitions, while blue arrow indicates allosteric activation. (b) Appearance of mature brown rice. (c) Effective tiller number, (d) Grain number per panicle. (e) Seed setting rate (%). (f) 1000‐grain weight (g). (g) Plot grain yield (kg/m2). Error bars represent SD of three biological replicates, and no significant difference was found between transgenic and WT plants.
