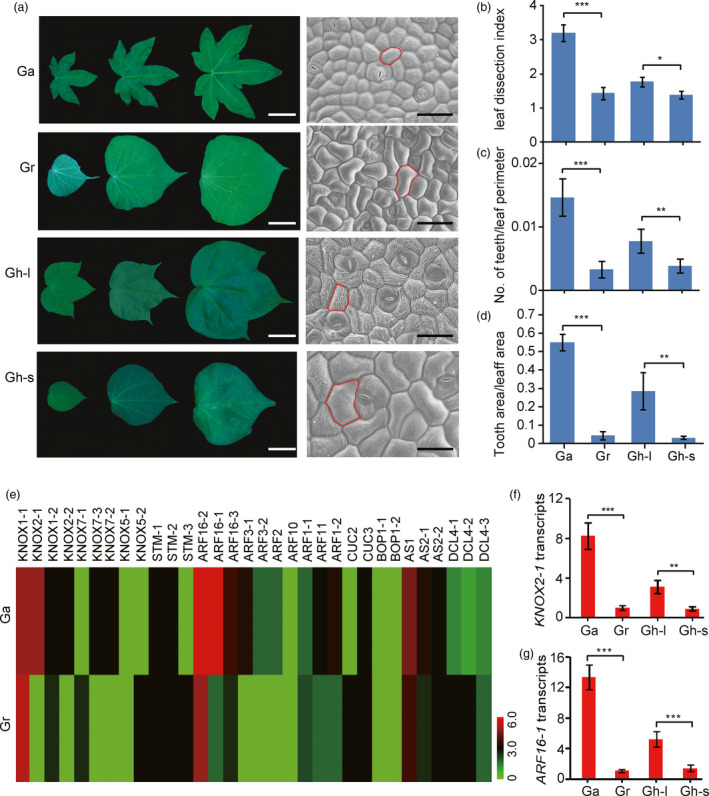
Figure 1.

Candidate genes evolved to mediate leaf shape diversity among different Gossypium (cotton) species. (a) Left, morphological analysis of the leaves of Gossypium hirsutum (Gh), Gossypium arboreum (Ga), and Gossypium raimondii (Gr). From top to bottom, the first true leaf of G. arboreum, the first true leaf of G. raimondii, the fourth true leaf of G. hirsutum (Gh‐lobed, Gh‐l), and the first true leaf of G. hirsutum (Gh‐smooth Gh‐s). In each image, from left to right, the representative leaves from three different developmental stages (5, 15, and 30 days, respectively). Bars = 4 cm. The right column of the images shows scanning electron micrographs of the epidermal cells at the base of the abaxial side of mature leaves of Ga, Gr, Gh‐l, and Gh‐s, respectively, from top to bottom. Bars = 50 µm. (b) to (d) Quantitative comparisons of the leaf shapes of Ga, Gr, Gh‐l, and Gh‐s from (a) based on the leaf dissection index (perimeter2/4π × leaf area) (b), the number of teeth/leaf perimeter (c), and the tooth area/leaf area (d). A total of 10 leaves from each genotype were used for the measurement. Data are presented as mean ± SE. Error bars represent standard errors of the means from three independent experiments. Statistical significance was determined using one‐way analysis of variance (ANOVA) combined with Tukey's test: *P < 0.05, **P < 0.01, ***P < 0.001. (e) Expression profiles of the genes involved in the regulation of leaf shape in Ga and Gr. Scaled log2 expression values are shown from green to red, indicating low to high expression levels, respectively. (f) Quantitative real‐time PCR (qRT‐PCR) analysis of KNOX2‐1 transcriptional levels in leaf primordia of Ga, Gr, Gh‐l, and Gh‐s. The expression level of the KNOX2‐1 gene in Gr was set to 1.0. (g) qRT‐PCR analysis of the ARF16‐1 mRNA levels in the leaf primordia of Ga, Gr, Gh‐l, and Gh‐s. The expression level of the ARF16‐1 gene in Gr was set to 1.0. Each qRT‐PCR experiment was performed in three biological replicates, and the error bars represent standard errors of the means from three independent experiments. Statistical significance was determined using one‐way ANOVA combined with Tukey's test. **P < 0.01; ***P < 0.001.
