
Fig. 2.
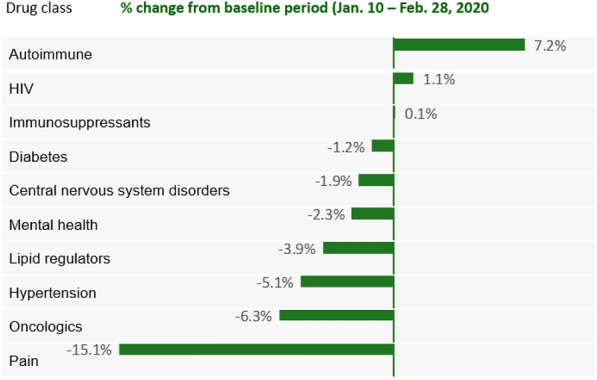
Percent change in filled prescriptions for selected drug classes, week ending May 1, 2020 vs. baseline and prior week.
Source: IQVIA National Prescription Audit; Market definitions courtesy of IQVIA Institute for Human Data Science [47]
Official websites use .gov
A
.gov website belongs to an official
government organization in the United States.
Secure .gov websites use HTTPS
A lock (
) or https:// means you've safely
connected to the .gov website. Share sensitive
information only on official, secure websites.
Percent change in filled prescriptions for selected drug classes, week ending May 1, 2020 vs. baseline and prior week.
Source: IQVIA National Prescription Audit; Market definitions courtesy of IQVIA Institute for Human Data Science [47]