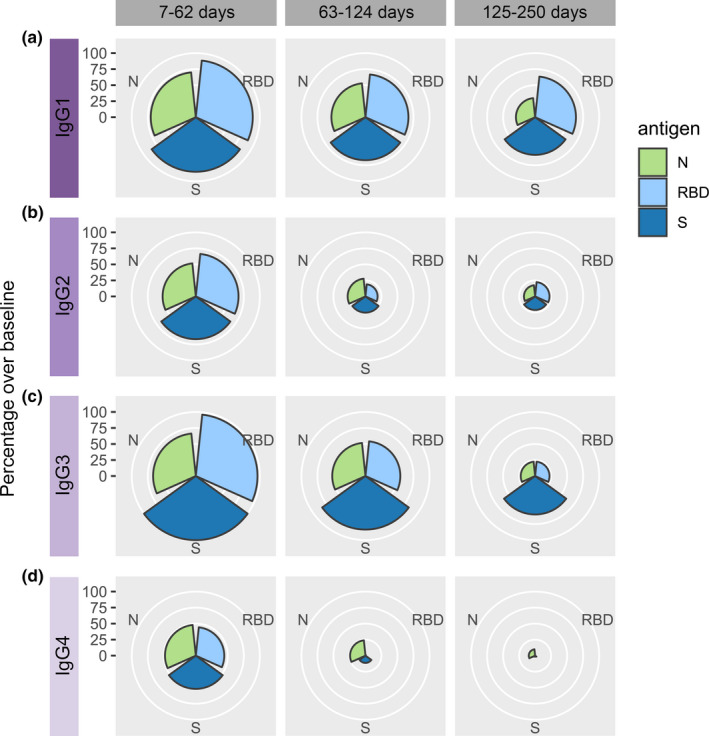
Figure 2.

Rose plots showing the percentage of PCR‐confirmed COVID‐19 patient samples that were above baseline for IgG1 (a), IgG2 (b), IgG3 (c) and IgG4 (d). Samples are stratified into three time groups (7–62 days, 63–124 days and 125–250 days). Nucleocapsid (N) protein in light green, receptor binding domain (RBD) in light blue and Spike (S) protein in dark blue.
