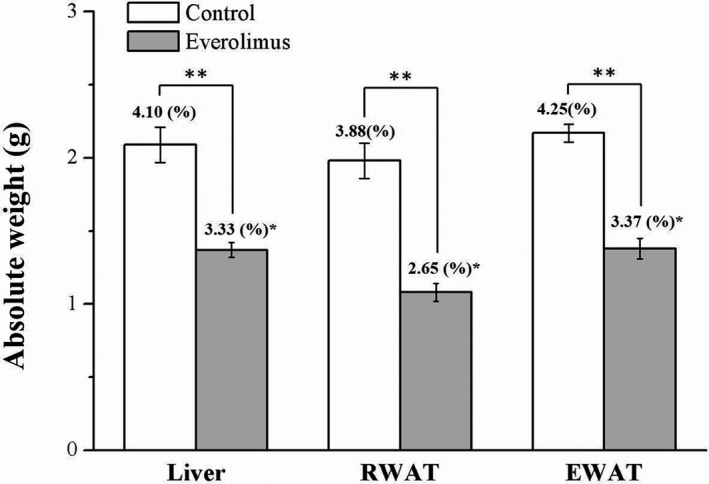
FIGURE 3.

Changes in absolute liver and EWAT‐ and RWAT‐pad weights (presented as % of the body weight) in the control and everolimus‐treated HFD‐fed mice over 56 treatment days. All values are presented as means ± SEMs, and n = 10 for all groups. *p < 0.05, significant; **p < 0.01, highly significant. RWAT, retroperitoneal white adipose tissue; EWAT, epididymal white adipose tissue
