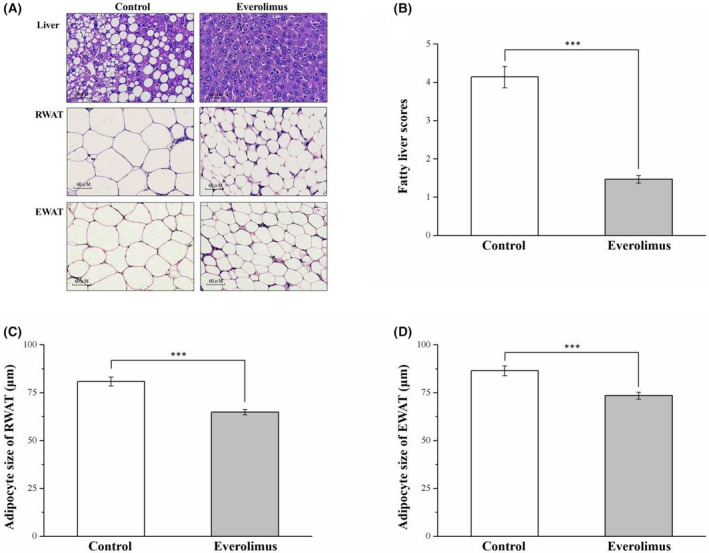
FIGURE 4.

(A) Photomicrographs of hematoxylin–eosin‐stained liver, RWAT, and EWAT sections (magnification, 200×). Changes in (B) fatty liver scores and (C) RWAT and (D) EWAT adipocyte cellularities in the control and everolimus‐treated HFD‐fed mice over 56 treatment days. All values are presented as means ± SEMs, and n = 10 for all groups. ***p < 0.001, extremely significant. Scale bar = 60 µm; RWAT, retroperitoneal white adipose tissue; EWAT, epididymal white adipose tissue
