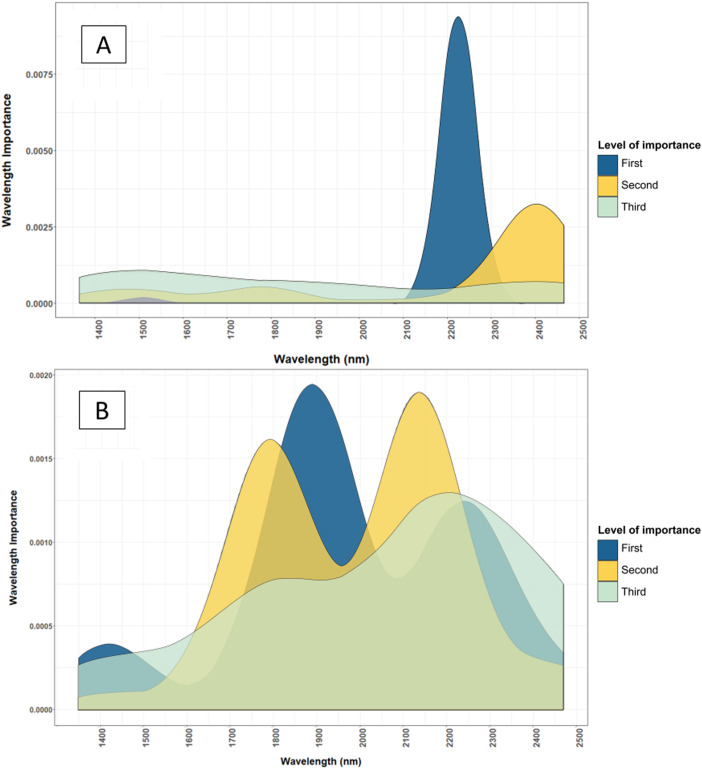
Figure 7. Comparison of important wavelenght used to determine the total N content of cotton leaves using NIRS models developed from dried and ground, and fresh and removed leaves.
(A) Important wavelength used to estimate total nitrogen content of dried and ground leaf samples. (B) Important wavelength used to estimate total nitrogen content of fresh and removed leaf samples. The dried and ground leaf models used wavelengths at 2,200–2,450 nm, where the fresh and removed leaf model used wavelengths at 1,425–2,500 nm. The level of importance shows the top three most important wavelengths used in the 50 iterations of the Cubist model to predict the leaf nutrients. The construction of the graph is explained in “Statistical Analysis”.

