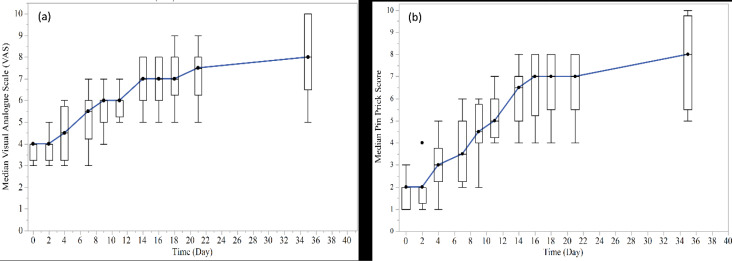
Figure 1.
Median VAS Scores and (b) Median Pinprick Scores of Patients (with Box plot) in Each Study Time Point. Note: VAS scores range from 0 to 10, considering a line with 0 indicating the complete absence of sensation and 10 at the extreme end expressing fully normal sensation; Pinprick score was recorded as the number of points in which the patient noticed the explorer tip touch in each session

