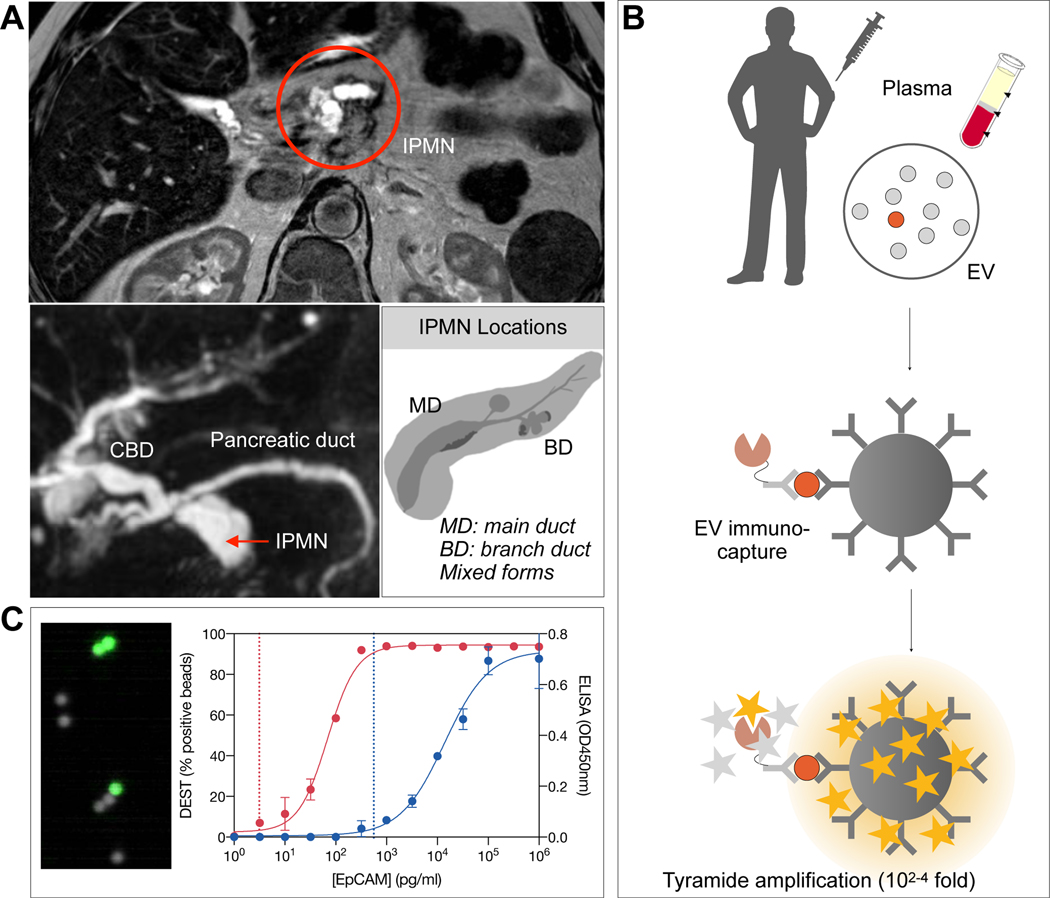
Figure 1. EV analysis for IPMN characterization.
(A) IPMNs are often incidentally detected by abdominal imaging. Repeat MRI is used to follow these T2-hyperintense lesions. Imaging alone has limited accuracy in separating benign from premalignant lesions, requiring resection. (B) Schematic diagram of the digital enzyme-linked immunosorbent assay (DEST) assay. EV are first captured on micron-sized beads via specific antibodies (see Table S3) and their presence is then detected via complementary antibodies followed by a tyramide signal amplification step. Presence of individual or multiple EV on a bead renders the entire bead as fluorescent. (C) Analysis is done in high throughput by counting the number of fluorescent beads. Overall the method is 3–4 orders of magnitude more sensitive than ELISA and uniquely suited to analyze rare EV subpopulations. Dashed lines represent the limit of detection for 1617 PDAC PDX EV in either the DEST (~100EV; left dashed line) or ELISA (~105 EV; right dashed line) assay.

