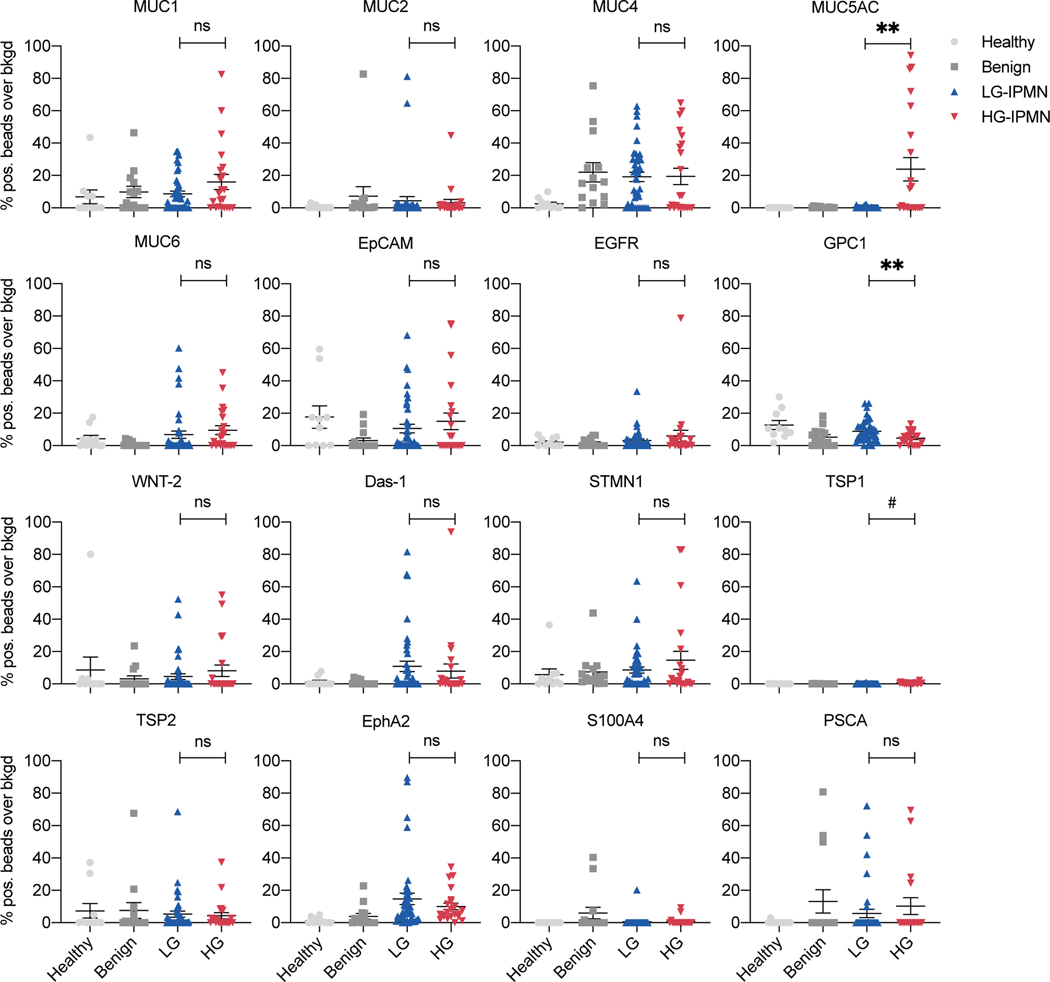
Figure 2. Analysis of 16 prototypical biomarkers in EV from different patient groups.
Each datapoint represent an EV sample from a single patient. Data shown are from healthy controls (light grey dots, n= 10); benign: age-matched control patients undergoing abdominal surgery but without evidence for any pancreatic lesions (dark grey squares, n=14 patients); low grade IPMN (blue triangles, n=40 patients) and high grade IPMN (red triangles, n=22 patients). See Table 1 for cohort demographics. Differences between HG-IPMN and LG-IPMN are shown by asterisk (**** p <0.0001, * p <0.05, ns = not statistically significant, p > 0.05;). #TSP1 is statistically significant but the extremely low signal over background makes the results clinically unreliable.

