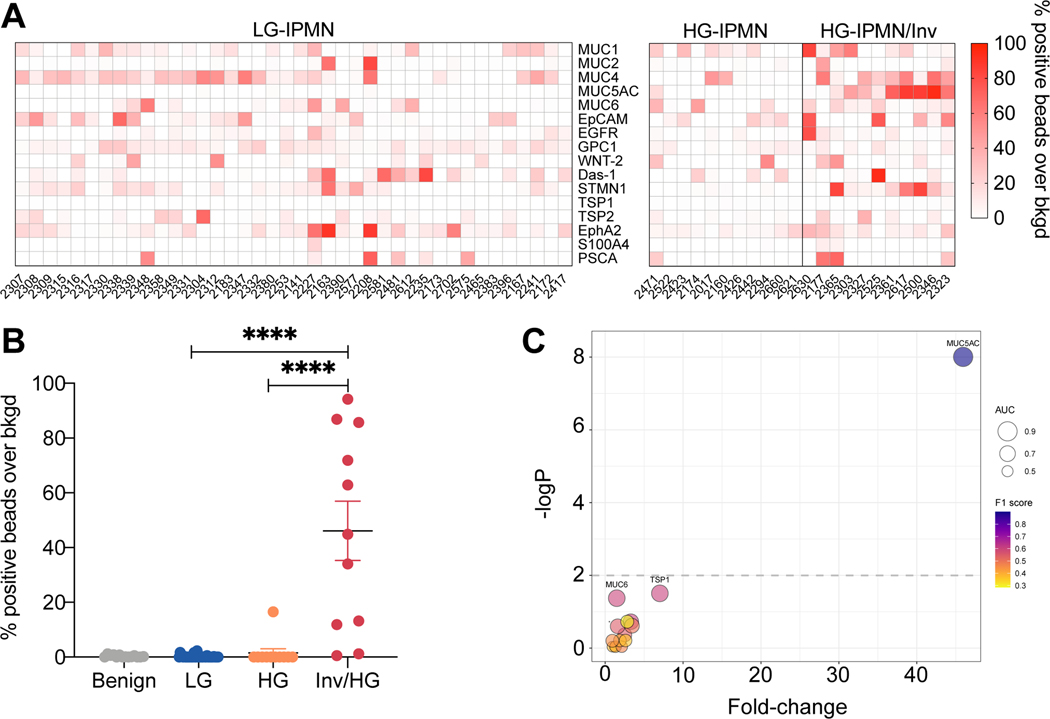
Figure 3. Discovery cohort analysis.
(A) EV biomarker analysis across all patients with IPMN. Each column refers to a single patient. Patients are grouped into low grade, high grade IPMN and high grade IPMN with invasive features determined by pathology. Notable differences between the groups can be seen for MUC5AC. (B) Subgroup comparison of MUC5AC positive EV. Note the significantly higher levels in invasive HG-IPMN against noninvasive HG-IPMN or LG-IPMN (Mann-Whitney, p < 0.0001 two-tailed). (C) Bubble plot of each molecular EV biomarker tested. The graph summarizes the following descriptive statistics: fold-change over LG-IPMN (x-axis), -log p-value by Mann-Whitney test (y-axis), and classifier metrics: AUC (bubble size), and F1 score (bubble color). Highly predictive EV biomarkers reside in the upper right hand corner. Only MUC5AC EV analysis stood out in the discovery cohort.

