

Abstract
Background & Aims:
Pancreatic ductal adenocarcinomas (PDAC) are characterized by fibrosis and an abundance of cancer-associated fibroblasts (CAFs). We investigated strategies to disrupt interactions among CAFs, the immune system, and cancer cells, focusing on adhesion molecule cadherin 11 (CDH11), which has been associated with other fibrotic disorders and is expressed by activated fibroblasts.
Methods:
We compared levels of CDH11 mRNA in human pancreatitis and pancreatic cancer tissues and cells, compared with normal pancreas, and measured levels of CDH11 protein in human and mouse pancreatic lesions and normal tissues. We crossed p48-Cre;LSL-KrasG12D/+;LSL-Trp53R172H/+ (KPC) mice with CDH11-knockout mice and measured survival times of offspring. Pancreata were collected and analyzed by histology, immunohistochemistry, and (single-cell) RNA sequencing; RNA and proteins were identified by imaging mass cytometry. Some mice were given injections of PD1 antibody or gemcitabine and survival was monitored. Pancreatic cancer cells from KPC mice were subcutaneously injected into Cdh11+/+ and Cdh11−/− mice and tumor growth was monitored. Pancreatic cancer cells (mT3) from KPC mice (C57BL/6), were subcutaneously injected into Cdh11+/+ (C57BL/6J) mice and mice were given injections of antibody against CDH11, gemcitabine, or small molecule inhibitor of CDH11 (SD133) and tumor growth was monitored.
Results:
Levels of CDH11 mRNA and protein were significantly higher in CAFs than in pancreatic cancer epithelial cells, human or mouse pancreatic cancer cell lines, or immune cells. KPC/Cdh11+/− and KPC/Cdh11−/− mice survived significantly longer than KPC/Cdh11+/+ mice. Markers of stromal activation entirely surrounded pancreatic intraepithelial neoplasias in KPC/Cdh11+/+ mice and incompletely in KPC/Cdh11+/− and KPC/Cdh11−/− mice, whose lesions also contained fewer FOXP3+ cells in the tumor center. Compared with pancreatic tumors in KPC/Cdh11+/+ mice, tumors of KPC/Cdh11+/− mice had increased markers of antigen processing and presentation; more lymphocytes and associated cytokines; decreased extracellular matrix components; and reductions in markers and cytokines associated with immunosuppression. Administration of the PD1 antibody did not prolong survival of KPC mice with 0, 1, or 2 alleles of Cdh11. Gemcitabine extended survival only of KPC/Cdh11+/− and KPC/Cdh11−/− mice or reduced subcutaneous tumor growth in mT3 engrafted Cdh11+/+ mice given in combination with the CDH11 antibody. A small molecule inhibitor of CDH11 reduced growth of pre-established mT3 subcutaneous tumors only if T and B cells were present in mice.
Conclusions:
Knockout or inhibition of CDH11, which is expressed by CAFs in the pancreatic tumor stroma, reduces growth of pancreatic tumors, increases their response to gemcitabine, and significantly extends survival of mice. CDH11 promotes immunosuppression and extracellular matrix deposition, and might be developed as a therapeutic target for pancreatic cancer.
Keywords: immunomodulation, anti-tumor immunity, activated stroma, desmoplasia, inflammation
Graphical Abstract

Lay Summary:
The authors found that loss or inhibition of a protein found in pancreatic tumors but not healthy pancreas extends survival of mice with pancreatic tumors by promoting an anti-tumor immunity and increasing the response to chemotherapy.
Introduction
Pancreatic cancer is soon to be the second leading cause of cancer-related death with an overall median survival of 8 - 11 months.1–3 Even though the mutation events that drive progression of pancreatic ductal adenocarcinoma (PDAC) are well known, it has a 5-year survival rate of about 10%.4 For 70% of patients, systemic chemotherapy is the only option and this mainly relieves the symptoms and/or slightly extends survival, rather than cures the patients.4 FDA-approved immunotherapy for microsatellite instability-high solid cancers (i.e. anti-PD1), is effective in only 1% of pancreatic cancer patients that have defects in mismatch repair genes.5 Hence, targeting other compartments of the PDAC microenvironment is an attractive approach for new therapeutics.
One of the hallmarks of PDAC is extensive desmoplasia/fibrosis that comprises up to 80% of the tumor.6 Cancer-associated fibroblasts (CAFs), including activated pancreatic stellate cells (PSCs), and their deposition of extracellular matrix influences tumor progression, metastasis, therapy resistance and formation of new blood vessels.6 CAFs release growth factors and cytokines that not only influence growth of pancreatic cancer cells, but also affect infiltration of immune cells into the tumor microenvironment (TME).6 Indeed, a third of human PDAC specimens have immune infiltration similar to melanoma, but mainly located in the stromal compartment.7 While the percentage of CD8+ cells in patients varies between <7% and 15-30% of CD45+ cells,8 PDAC is characterized by high numbers of immunosuppressive cells, such as FOXP3+ T regulatory cells (T-regs), myeloid-derived suppressive cells (MDSCs) and macrophages.9 However, depletion of immunosuppressive FOXP3+ cells promotes PDAC progression,10 and depletion of CAFs themselves is just as likely to promote PDAC as inhibit it.11 Moreover, some fibrosis could help contain PDAC growth and spread,11 and it is a predictor of improved PDAC outcome in a neoadjuvant setting.12 Hence it may be better to modulate CAF/immune infiltrate cross-talk to limit tumor growth, rather than entirely deplete CAFs from the TME.
During disease progression, the stromal compartment of patients with pancreatitis and PDAC markedly increases expression of the adhesion molecule cadherin 11 (CDH11), which is not generally expressed in pancreatic cancer cell lines.13,14 Interestingly, CDH11 is also increased in activated fibroblasts associated with chronic inflammatory diseases such as rheumatoid arthritis, inflammatory bowel disease, pulmonary fibrosis, scleroderma and heart fibrosis.15–20 Importantly, CDH11-knockout animals are significantly protected from these diseases. As CDH11 is associated with chronic inflammation and fibrosis, we hypothesized that targeting CDH11 expressed in PDAC stroma would modify the TME and alter the crosstalk between CAFs, immune cells and tumor cells, while preserving the stromal compartment. Here, we show that loss or inhibition of CDH11 significantly extends survival in immunocompetent genetic and transplant mouse models of PDAC, is associated with anti-tumor immunity, and promotes responsiveness to a chemotherapeutic, gemcitabine. Our previously characterized small molecule CDH11 -inhibitor15 significantly reduces growth of pre-existing tumors even when used as a single agent. Taken together these data should stimulate a translation of anti-CDH11 therapy perhaps coupled with standard-of-care in patients with PDAC and other CDH11-positive malignancies.
Materials and Methods
Mice
The experimental protocols were approved by the Georgetown University Animal Care and Use Committee (2016-1140). A pair of Cdh11−/− mice21 was kindly provided by Dr. Michael Brenner from Harvard University. A breeding pair of p48-Cre;LSL-KrasG12D/+;LSL-Trp53R172H/+ (KPC) mice22 was kindly provided by Dr. Anton Wellstein from Georgetown University. C57BL/6J mice (Cat# 000664; RRID: IMSR_JAX:000664) and Rag1-mutant mice on C57BL/6J background (Cat# 002216; RRID: IMSR_JAX:002216) were purchased from The Jackson Laboratory. In transplant experiments, 12-week old C57BL/6J and Rag1-mutant (on C57BL/6J background) mice were bilaterally subcutaneously (s.c.) injected with 5x10⁵ mT3 pancreatic cancer cells, derived from a Kras+/LSL-G12D;Trp53+/LSL-R172H;Pdx-Cre mouse on C57BL/6 background23. Additionally, Cdh11+/+ or Cdh11−/− mice were engrafted with 1x10⁶ mPDAC (clone G8) cells. Both genders of mice were equally represented throughout all in vivo experiments. Mice were housed in specific pathogen free environment under standard conditions.
Animal treatment
Anti-PD1 (InVivoPlus anti-mouse PD1 (CD279), clone RMP1-14, Cat# BP0146, Bio X Cell) was administered intraperitoneally (i.p.) at 250 μg/mouse, 2x week. Gemcitabine (G-4177, LC Laboratories) was administered i.p. at 100 mg/kg, 2x week. Treatment with CDH11 monoclonal antibody (mAb), SYN0012 (Adheron) was administered i.p. at 10 mg/kg, 2x week. Treatment with a small molecule CDH11-inhibitor, SD133, was administered i.p. at 150 mg/kg, 40 mg/kg or 10 mg/kg, 4x week. Stock solution of SD133 at 375 mg/mL was made in DMSO (Sigma), and further diluted in 30% PEG400 (Sigma).
Imaging mass cytometry (IMC)
IMC data acquisition and visualization were performed as previously described.24 Briefly, stained and air-dried slides were inserted into the ablation chamber of the Hyperion™ Imaging System (Fluidigm), where a pulsed 200 Hz laser is focused to a 1 μm spot and applied over a user-defined area, ablating adjacent spots in 1 μm steps as the slide moves under the laser beam. The plumes of vaporized material are streamed by inert gas with high time-fidelity into the inductively coupled plasma ion source for analysis by the mass cytometer. Images of each mass channel were reconstructed by plotting the laser shot signals in the order in which they were recorded, line scan by line scan. Multi-channel images were overlaid for desired channel combinations in MCD™ Viewer v1.0.560.2 (Fluidigm).
Statistical analysis
Statistical tests were performed using GraphPad Prism 5 software (GraphPad Software, www.graphpad.com; RRID: SCR_002798), as indicated in each figure legend. Each figure specifies number of individual data points. Mean and standard error of the mean are shown.
See Supplementary Materials for cell lines, primary cell isolation, antibodies, immunohistochemistry (IHC), histologic quantification, immunofluorescence, protein isolation, Western blotting (WB), cytokine and phospsho-protein expression, RNA isolation, cDNA synthesis, quantitative PCR (qPCR), Nanostring gene expression analysis, RNA sequencing (RNAseq), single cell RNA sequencing (scRNAseq), metal conjugation of oligonucleotide probes used in IMC, in situ hybridization by RNAscope, and antibody staining for IMC.
Results
CDH11 is increased in CAFs of pancreatic cancer patients, mouse models and cells
CDH11 transcripts are increased up to 25-fold in patients with pancreatitis and pancreatic cancer when compared to normal pancreas (Figure 1A, Oncomine data extracted from25–29), which was confirmed by CDH11 IHC staining with 5B2H5 antibody (Figure 1B–D). Supplementary Figure 1 provides some added technical clarifications. Next, we assessed CDH11 mRNA expression across different human and mouse pancreatic cancer cell lines and primary CAFs isolated from human PDAC, and found that in human and mouse, CDH11 mRNA expression was 10-10,000-fold higher in CAFs than in pancreatic cancer epithelial cells (Figure 1E). Similarly, human primary CAFs express high levels of CDH11 protein, while a panel of human and mouse pancreatic cancer epithelial cell lines express very low (usually undetectable) levels of CDH11 but high levels of E-cadherin (Figure 1F). The activation status of human CAFs was confirmed by positive staining for alpha smooth muscle actin (αSMA) (Figure 1G). Furthermore, scRNAseq data derived from a Kras+/LSL-G12D;Trp53+/LSL-R172H;Pdx-Cre PDAC mouse model obtained from the publicly available dataset (GSE114417)30, showed that Cdh11 is primarily expressed by CAFs, with negligible expression in other cell types including cancer epithelial cells or immune cells (Figure 1H, Supplementary Figure 2). Additionally, we generated subcutaneous tumors in immunocompetent C57BL/6 mice using the PDAC cell line, mT3, derived from a Kras+/LSL-G12D;Trp53+/LSL-R172H;Pdx-Cre C57BL/6 mouse23, and allowed for tumor growth for 3 weeks. Upon scRNAseq analysis of immune-cell-depleted tumors, we detected Cdh11 expression exclusively in two CAF subpopulations, with virtually no expression in cancer epithelial cells (Figure 1I, Supplementary Figure 3) (https://datadryad.org, doi: 10.6071/M3HM32). These data indicate that in the context of pancreatic cancer, CAFs are the predominant cell type that produces CDH11.
Figure 1. CDH11 is significantly increased in human and mouse PDAC CAFs and pancreatitis stroma.
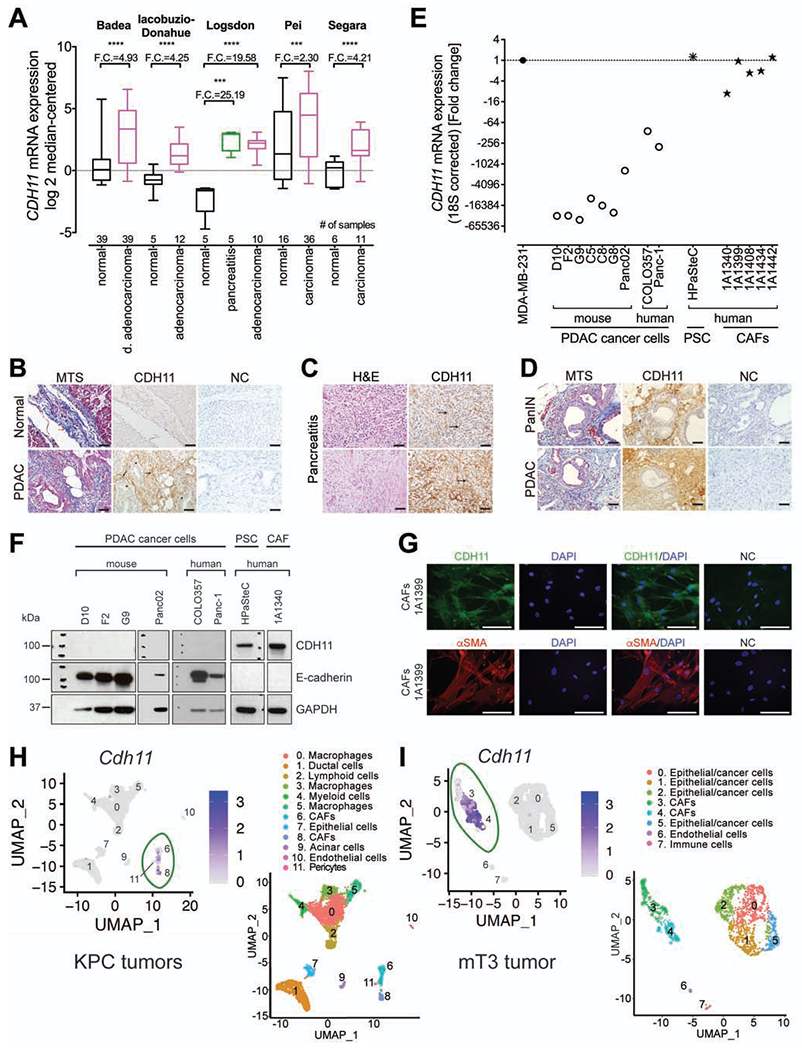
(A) CDH11 mRNA in pancreatic carcinoma, ductal (d.) adenocarcinoma, and pancreatitis compared to normal pancreas. Box defines 25th to 75th percentiles, horizontal line defines median, and whiskers minimum and maximum. The fold change (F.C.) is indicated. P-values were determined by unpaired two-tailed t-test. Representative histology of: (B) human normal pancreas and PDAC stained with MTS and CDH11 IHC (5B2H5); (C) human pancreatitis stained with H&E and CDH11 IHC (5B2H5); (D) mouse PanIN and PDAC isolated from KPC mice stained with MTS and CDH11 IHC (5B2H5). (B-D) Black arrows represent CDH11-positive staining in CAFs; asterisks depict CDH11-negative cancer epithelial cells; red arrows represent positive MTS staining; NC – negative control for CDH11 IHC; scale bars: 50 μm. (E) CDH11 mRNA expression in human and mouse PDAC epithelial cell lines and primary human PSC and CAF cell lines. MDA-MB-231 cell line was used as a positive control for CDH11 expression. (F) Immunoblot for CDH11 (5B2H5) and E-cadherin in PDAC epithelial, PSC and CAF cell lines. (G) Immunofluorescent staining of primary human CAF cell line, 1A1399 for CDH11 (5B2H5), αSMA and NC. Scale bars: 50 μm. Single cell RNAseq analysis of (H) KPC mouse tumors (GSE114417)30 and (I) immune-cell-depleted s.c. mT3 pancreatic tumors. Cell clusters from 10x Genomics scRNAseq analysis visualized by Uniform Manifold Approximation and Projection (UMAP). Feature plots show Cdh11 expression in different cell types from pancreatic cancer microenvironment (CAFs in green ovals). Colors indicate clusters of various cell types.
Loss of CDH11 significantly improves survival in KPC mouse model
To study the role of CDH11 in PDAC, we used an immunocompetent p48-Cre;LSL-KrasG12D/+;LSL-Trp53R172H/+ (KPC) mouse model that resembles progression of human disease22. By introducing the knockout Cdh11 allele (Cdh11−/−)21, we produced three KPC genotypes with different Cdh11 status (KPC/Cdh11+/+, KPC/Cdh11+/− and KPC/Cdh11−/−) (Supplementary Figure 4).
Strikingly, mice with zero or one allele of Cdh11 survived significantly longer than mice with both wild-type copies of Cdh11 (Figure 2A). Moreover, at the time of euthanasia, pancreata from the KPC/Cdh11+/+ animals were significantly larger (1.2 g) than in KPC/Cdh11−/− mice (0.6 g) (Figure 2B). The macrometastasis rate in KPC/Cdh11+/+ mice (82%) was similar to KPC/Cdh11+/− (79%) and KPC/Cdh11−/− mice (79%), and to the macrometastasis rate of 76% shown by Hingorani et al.22 It is likely that KPC/Cdh11−/− mice develop additional congenital issues, due to the role of CDH11 during development31 which coupled with PDAC diminishes overall animal health and mice succumb to the disease with smaller tumors than their KPC/Cdh11+/− counterparts.
Figure 2. Loss of CDH11 significantly prolongs survival of PDAC-bearing mice, affects stromal activation and FOXP3+ cell localization.

(A) A Kaplan-Meier plot for KPC/Cdh11+/+, KPC/Cdh11+/− and KPC/Cdh11−/− mice. P-values were determined by log-rank Mantel-Cox test. (B) Mass of pancreata at the time of euthanasia. Each data point represents a measurement from an individual mouse. P-values were determined by unpaired two-tailed t-test. (C) Representative pictures of αSMA IHC staining of pancreata. Green line outlines early PanIN lesions. Scale bars: 100 μm. (D) Quantification of αSMA+ IHC staining represented as % area of pancreata. P-values were determined by unpaired two-tailed t-tests. (E) Representative pictures of FOXP3 IHC staining of PDAC tumor center (>300 μm from the tissue margin) from KPC mice. Yellow arrows represent FOXP3-positive staining. Scale bars: 100 μm. Quantification of FOXP3+ cells in the (F) center, (G) periphery, and (H) ratio of FOXP3+ cells in center versus periphery of KPC mice. Minimum five pictures taken at 40x magnification from the center, and the periphery of each tumor were analyzed. Each data point represents an individual PDAC sample. P-values were determined by unpaired two-tailed t-tests. (I) TLS quantification in H&E stained pancreata of KPC mice using ImageJ. Each data point represents a ratio of total TLS area over pancreata area from an individual mouse. P-values were determined by unpaired two-tailed t-test.
Loss of CDH11 modulates the tumor microenvironment
CDH11-deficiency affects the pattern of fibrosis in the KPC mouse model
To assess correlation between stromal activation and Cdh11 status, we analyzed the pattern of αSMA expression, and collagen content by gene expression analyses. In the KPC model, a difference in stromal activation assessed by αSMA+ IHC staining was clearly apparent around early pancreatic intraepithelial neoplasms (PanIN). At the PanIN1/2 stage, KPC/Cdh11+/+ mice exhibited substantial stromal activation around every lesion, while KPC/Cdh11-deficient animals displayed incomplete encirclement of the lesions (Figure 2C). Quantification of αSMA+ staining (Figure 2D) was confirmed by RNAseq analysis of pancreata collected at the time of euthanasia, showing ~2.5-fold decrease in Acta2 (αSMA) in KPC/Cdh11+/− mice compared to KPC/Cdh11+/+ (Supplementary Table 1). Additionally, the expected 2.45-fold decrease in Cdh11 transcripts of KPC/Cdh11+/− pancreata in comparison to KPC/Cdh11+/+ (Supplementary Table 1) correlated with ~2-3-fold reduced expression of multiple collagens and fibronectin (Supplementary Tables 1 and 2).
CDH11-deficiency reduces T-reg infiltration of the PDAC tumor center
Next, we analyzed the distribution of FOXP3+ T-regs within the PDAC tissue of KPC mice (Figure 2E–H). The total number of FOXP3+ cells (tumor center + periphery) was similar in KPC/Cdh11+/+ and KPC/Cdh11+/− tumors, but was significantly reduced in KPC/Cdh11−/−. A marked reduction in number of immunosuppressive FOXP3+ cells in the tumor center (>300 μm from the tissue margin) of KPC/Cdh11-deficient animals correlated with their improved survival (Figure 2A, F and H), while increased T-reg infiltration of the KPC/Cdh11+/+ tumor center positively correlated with tissue and serum expression of cytokines that attract T-regs: CCL17 and CCL2232 (Supplementary Tables 3 and 4). Additionally, we detected more tertiary lymphoid structures (TLSs) in pancreata of KPC/Cdh11-deficient mice (Figure 2I), together with an increase in TLS-promoting cytokines Ccl21, Ccl19 and Cxcl13, and their receptors Ccr7 and Cxcr5, when compared to KPC/Cdh11+/+ (Supplementary Tables 2 and 3).
Cdh11−/− mice reject transplanted tumors and induce immune memory
In an additional series of experiments, mouse pancreatic cancer cells (mPDAC, clone G8), isolated from the pancreatic cancer of a KPC mouse, were inoculated into Cdh11+/+ and Cdh11−/− animals. The CDH11 colony was bred into the background of the KPC colony for multiple generations to produce Cdh11+/+ and Cdh11−/− littermates on the same mixed background as the mPDAC cells. Thirteen Cdh11+/+ and twelve Cdh11−/− littermate mice were transplanted with mPDAC cells. Initial s.c. tumor growth was comparable in Cdh11+/+ and Cdh11−/− animals. However, approximately 10-14 days after mPDAC cell injection, s.c. tumors (with average volume of ~400mm3) in many Cdh11−/− animals started regressing (Supplementary Figure 5A). The median survival of engrafted Cdh11+/+ mice was only 17 days, and all 13 mice succumbed to the disease by one month after mPDAC engraftment. Cdh11−/− mice survived significantly longer (101 days on average), and ascites developed in only 17% of animals, c.f. 92% of Cdh11+/+ mice (Supplementary Figure 5B). Furthermore, αSMA+ IHC and MTS quantification showed decreased stromal activation and no excess collagen deposition in Cdh11−/− mice compared to Cdh11+/+ littermates during the 3-week time period after mPDAC cell engraftment (Supplementary Figure 5C–H). Finally, three Cdh11−/− mice that initially grew large s.c. tumors (~100-500 mm3), lost tumors entirely without sign of recurrence for >1.5 year. Two of them survived longer than 2 years, and were rechallenged with the same mPDAC cell line by s.c. injection. Upon re-challenge, these Cdh11−/− mice did not develop any tumors (Supplementary Figure 5I), suggesting the presence of immune memory long after the initial challenge. At the same time, Cdh11+/+ animals formed large tumors with the same mPDAC cell preparation. Although we acknowledge that this model is not truly syngeneic even after backcrossing, only Cdh11−/− mice lost their tumors, while none of their Cdh11+/+ littermates did.
CDH11-deficiency induces an anti-tumor immunity and reduces immunosuppression
To achieve a greater insight into the PDAC TME, we analyzed gene expression of pooled pancreatic tumors isolated from KPC/Cdh11+/− mice at the time of euthanasia, normalized to KPC/Cdh11+/+ by Nanostring (Figure 3A–H, Supplementary Table 2). The Nanostring data was confirmed by qPCR reactions on individual PDAC samples (Supplementary Figure 6A), in addition to RNAseq analysis (GSE157781), (Supplementary Table 1) and cytokine mRNA and protein expression, including RNA and protein detection by IMC (Figure 3I–K, Supplementary Table 3).
Figure 3. PDAC tissues from KPC/Cdh11+/− mice are associated with increased anti-tumor immunity, and decreased immunosuppression in comparison to KPC/Cdh11+/+.

(A-H) Differential gene expression analysis of pooled PDAC samples from KPC/Cdh11+/− mice (n=5) normalized to KPC/Cdh11+/+ (n=7). Top 20 genes with (A) increased, and (B) decreased expression; and expression of (C) antigen processing and presentation, (D) cDC, (E) M1 macrophage, (F) M2 macrophage, (G) B cell, and (H) MDSC markers. (I) IMC for CD4, CD8a and CD19 proteins coupled with RNAscope for Ccl21a mRNA performed on PDAC samples from KPC/Cdh11+/+ and KPC/Cdh11+/− mice. Bigger panels represent merge staining, and smaller panels represent single staining of the same region. DapB was used as a negative control (NC) for mRNA detection by RNAscope. Six regions of interest per PDAC sample (n=3 mice per genotype) were analyzed and quantified by ImageJ using integrated density (IntDen) of the signal. P-values were determined by unpaired two-tailed t-test. Arrowheads point to positive staining; scale bars: 50 μm. Cytokine analysis of pooled (J) serum, and (K) PDAC samples of KPC/Cdh11+/+ (n=3 serum; n=7 tumor) and KPC/Cdh11+/− mice (n=3 serum; n=6 tumor), performed in duplicates. P-values were determined by unpaired two-tailed t-test, and reported as *P<.05, **P<.01, ***P<.001.
Compared to KPC/Cdh11+/+, in pancreata of KPC/Cdh11+/− mice we detected increased expression of multiple antigen processing and presentation genes, T cell receptor (TCR) components (Cd3g, Cd3e, Cd3d, Cd247), and kinases downstream of TCR (Lck, Itk and Zap70) (Figure 3A and C, Supplementary Table 2). Moreover, by combining metal-based RNAscope with antibody staining using IMC, in KPC/Cdh11+/− pancreata we detected an increase in cell infiltrates positive for CD4, CD8a or CD19 protein and Ccl21a mRNA-expressing cells when compared to KPC/Cdh11+/+ (Figure 3I), as suggested by Nanostring data (Supplementary Table 2). Furthermore, phosphorylation of PKC-θ and SLP-76, which mediate TCR signaling33,34 was increased in KPC/Cdh11+/− tumors (Supplementary Table 5, Supplementary Figure 7A). Additionally, markers associated with conventional dendritic cells (cDC), M1 macrophages, and B cells were increased in KPC/Cdh11+/− tumors (Figure 3D–E and G), as well as cytokines (mRNA and protein) that attract B, T, and dendritic cells: CXCL13, CCL21 and CCL1935 (Figure 3I and K, Supplementary Tables 2, 3, and 4). Furthermore, in KPC/Cdh11+/− tumors, phosphorylation of mTOR and PI3K was decreased (Supplementary Table 5, Supplementary Figure 7A), along with reduced expression of M2 macrophage, MDSC and other immunosuppressive markers (Figure 3B, F and H). When we queried the Skyline database36 for the top 20 increased or decreased genes from the KPC/Cdh11+/− tumors identified by Nanostring (Figure 3A–B), we found that the up-regulated genes are associated predominantly with T cells, and some with cDCs, B cells, and natural killer (NK) cells (Supplementary Figure 6B). In contrast, the decreased genes are mainly associated with cells that share immunosuppressive properties or play a role in chronic inflammation: macrophages, monocytes and neutrophils (Supplementary Figure 6B). Furthermore, protein levels of many soluble factors that support infiltration by immunosuppressive cells, such as CSF3, DKK1, CD14, IL11, C5/C5a, CCL17, CCL22, etc. (Figure 3J–K, Supplementary Tables 3 and 4, Supplementary Figure 7B–C) were decreased in KPC/Cdh11+/− mice. Additionally, changes in ADIPOQ and LDLR protein levels (Figure 3K, Supplementary Tables 3 and 4) indicate altered lipid metabolism. Ingenuity Pathway Analysis of RNAseq data also indicates CDH11-dependent changes in lipid metabolism, extracellular matrix modification, fibrosis and stellate cell activation, agranulocyte and granulocyte diapedesis, and others (Supplementary Table 6).
Loss or inhibition of CDH11 combined with gemcitabine or anti-PD1
Even though the effects of CDH11 loss alone on survival are substantial, we next asked if combination of CDH11 loss or inhibition with currently available immunotherapy (PD1 mAb),5 or a commonly used chemotherapy in PDAC patients, gemcitabine,37 could further extend survival. Although KPC/Cdh11+/+ mice showed a trend towards improved survival following anti-PD1 treatment, this was not statistically significant, and KPC/Cdh11-deficient animals did not show any sign of further improvement after anti-PD1 injections (Figure 4A).
Figure 4. Loss of Cdh11 promotes response to gemcitabine.

A Kaplan-Meier plot of KPC/Cdh11+/+ versus KPC/Cdh11-deficient mice, KPC/Cdh11− (KPC/Cdh11+/− and KPC/Cdh11−/−) treated with: (A) PD1 mAb; or (B) gemcitabine (GEM). Duration, dose and treatment schedule are indicated on the graphs. P-value was determined by log-rank Mantel-Cox test. Cytokine analysis of pooled (C) serum, and (D) PDAC samples of KPC/Cdh11+/+ (n=3 serum; n=4 tumor) and KPC/Cdh11+/− mice (n=3 serum; n=5 tumor) treated with gemcitabine, performed in duplicates. P-values were determined by unpaired two-tailed t-test, and reported as *P<.05, **P<.01, ***P<.001, ****P<.0001. (E) Representative pictures of CD19 IHC staining of pancreata from gemcitabine treated KPC/Cdh11+/+ and KPC/Cdh11+/− mice. Black arrowheads represent CD19-positive staining; PC – positive control; NC – negative control; scale bars: 100 μm. (F) Quantification of CD19+ staining of pancreata of 3 KPC/Cdh11+/+ and 3 KPC/Cdh11+/− mice. Minimum of eight pictures taken at 40x magnification from each tumor were analyzed. P-value was determined by unpaired two-tailed t-test.
We next used gemcitabine, a nucleoside analog that inhibits DNA synthesis upon incorporation into DNA. Starting at 100 days of age, we treated KPC mice for 6 weeks, equivalent to a single course of chemotherapy in the human disease. Remarkably, the first PDAC-related death in the KPC/Cdh11-deficient group occurred only after gemcitabine treatment ended, much later than in the KPC/Cdh11+/+ mice, and its overall survival improved significantly over the KPC/Cdh11-deficient untreated group (Figure 4B). However, hierarchical clustering and principal component analysis of RNAseq data suggests that genotype (Cdh11 status) has a larger impact on the transcriptome than gemcitabine treatment (Supplementary Figure 8). RNAseq analysis (GSE157781) revealed a marked increase in the expression of numerous immunoglobulins and antigen-presentation genes (H2-Eb1, H2-T22, H2-T23, Ciita, H2-DMb1, H2-Ab1, Cd74, H2-Aa, H2-DMa, H2-K1) in PDAC tissues from gemcitabine-treated KPC/Cdh11+/− mice compared to gemcitabine-treated KPC/Cdh11+/+ animals (Supplementary Table 1). In addition, CCL21, Ccl19 (attract T and dendritic cells35) and CXCL13 (attracts B cells35) were increased on protein and mRNA level (Figure 4D, Supplementary Figure 7C, Supplementary Tables 1, 3 and 4). IL4, which promotes B cell proliferation and survival38, increased >2-fold in serum of KPC/Cdh11+/− gemcitabine-treated mice (Figure 4C, Supplementary Figure 7B, Supplementary Table 3). Together, these data suggest PDAC infiltration with B cells in KPC/Cdh11+/− animals upon gemcitabine treatment, which was confirmed upon CD19 IHC staining and quantification (Figure 4E–F). Ingenuity Pathway Analysis also indicated changes in B cell development, antigen presentation, and T cell differentiation, signaling and activation pathways, and dendritic cell maturation (Supplementary Table 7). Finally, protein levels of multiple other cytokines associated with tumor progression or poor prognosis (e.g. IL11, VEGFA, PTX3, CRP and IL1A)39–42 were decreased in tumor tissues of gemcitabine-treated KPC/Cdh11+/− mice in comparison to gemcitabine-treated KPC/Cdh11+/+ mice (Figure 4D, Supplementary Figure 7C, Supplementary Table 3).
CDH11 mAb in combination with gemcitabine in the mT3 transplant mouse model
Next, we used a CDH11 mAb, which targets the cell-to-cell adhesion-binding region of CDH11, in an immunocompetent transplant mouse model. C57BL/6J mice were s.c. injected with mT3 pancreatic cancer cells, derived from a Kras+/LSL-G12D;Trp53+/LSL-R172H;Pdx-Cre mouse on C57BL/6 background23. Engrafted mice were treated with a CDH11 mAb (SYN0012)43 ± gemcitabine. As expected, gemcitabine-only treatment did not reduce tumor growth (Figure 5A). Although treatment with CDH11 mAb alone also failed to attenuate tumor growth (Figure 5B), combination of CDH11 mAb plus gemcitabine modestly but significantly reduced tumor growth (Figure 5C). The combinatorial effect observed here is somewhat similar to the outcome in the gemcitabine-treated KPC/Cdh11+/− mice.
Figure 5. Effective attenuation of pancreatic cancer growth upon CDH11 inhibition requires the presence of T and B cells.

C57BL/6J mice engrafted with mT3 cells (derived from a PDAC of a KPC C57BL/6 mouse23) treated with (A) gemcitabine (GEM), (B) CDH11 mAb, and (C) CDH11 mAb + GEM. (D) Binding model of small molecule CDH11-inhibitor, SD133 (green) with the extracellular domain 1 of CDH11. C57BL/6J mice engrafted with mT3 cells treated with (E) SD133 for 2 weeks, (F) SD133 for 2 weeks + GEM, (G) SD133 for 5 weeks. (H) C57BL/6J mice with pre-existing mT3 tumors treated with SD133 at 40 mg/kg or 10 mg/kg. (I) Immunocompromised Rag1-mutant mice (on C57BL/6J background) with pre-existing mT3 tumors treated with SD133 at 40 mg/kg. The dose, route and treatment schedule are indicated on graphs. P-values for interaction were determined by two-way ANOVA.
A small molecule CDH11-inhibitor reduces tumor growth in the mT3 transplant mouse model
Previously, we designed several families of drug-like small molecule inhibitors of CDH1115. One of these, SD133, binds specifically to the CDH11 binding pocket (Figure 5D) with low μM affinity in vitro, and it was previously characterized and validated in vitro15. We treated mT3 tumor-bearing C57BL/6J mice with SD133 beginning on day 2 after engraftment, and observed a marked reduction in tumor growth (Figure 5E) with no decrease in animal weight during the experiment (Supplementary Figure 9). After discontinuation of SD133 treatment, tumors began to grow, but they remained significantly smaller than tumors in control animals. As SD133 treatment effectively attenuated tumor growth during the administration period, we did not observe a combinatorial effect with gemcitabine (Figure 5F). In the second experiment, we continued SD133 administration throughout the study and observed reduced tumor growth for the duration of injections (Figure 5G). In a separate experiment, we started treatment once the average tumor volume reached 100 mm3. SD133 treatment at 40 mg/kg and 10 mg/kg significantly reduced growth of pre-existing tumors in a dose-dependent manner (Figure 5H). Collectively, our data confirm that therapeutic inhibition of CDH11, perhaps in combination with gemcitabine, constrains the PDAC progression.
Effective attenuation of PDAC growth upon CDH11 inhibition requires the presence of T and B cells
Finally, to explore the immunomodulatory role of CDH11-inhibition in the pancreatic cancer context, we engrafted immunocompromised Rag1-mutant C57BL/6J mice with mT3 pancreatic cancer cells, derived from a KPC C57BL/6 mouse23. After s.c. tumors reached an average volume of 100 mm3, we started treating mice with 40 mg/kg of SD133, the dose that was effective in immunocompetent C57BL/6J mice. Interestingly, in the absence of mature T and B cells, the small molecule CDH11-inhibtor, SD133 did not suppress tumor growth - indicating that T and B cells are necessary components of CDH11-mediated immunomodulation of the PDAC TME (Figure 5I).
Discussion
Here, we showed that CDH11 is primarily expressed by CAFs in stroma of human and mouse PDAC. Cdh11-deficiency correlates with: (1) decreased stromal activation, and collagen and fibronectin expression in PDAC. This is consistent with the demonstration that fibroblasts isolated from Cdh11+/+ mice produce more collagen than those from Cdh11-deficient mice44. Moreover, reduced αSMA expression around early PanIN lesions in KPC/Cdh11-deficient mice suggests a delayed stromal activation, which may ultimately translate into sustained or delayed tumor progression. Importantly, a battery of approaches, including RNAseq, Nanostring, RNA and protein detection by IMC, cytokine and phosphoprotein arrays, showed that Cdh11-deficiency contributes to anti-tumor immunity by modulating the PDAC TME through: (2) decreasing markers associated with immunosuppressive cells, such as MDSCs and M2 macrophages; (3) promoting expression of antigen processing and presentation genes as well as professional antigen-presenting cell markers, such as cDCs, M1 macrophages and B cells; and (4) increasing PDAC infiltration by T and B cells. Both outcomes are likely mediated by secreted cytokines that attract or deter specific immune cells, and/or skew immune cell differentiation. For example, Cdh11-deficiency leads to a reduced number of FOXP3+ cells in the tumor center - possibly driven by decreased expression of CCL17 and CCL22. However, expression of myeloid-recruiting cytokines associated with T-reg depletion: Ccl3, Ccl6 and their receptor Ccr1,10 as well as MDSC markers, decreased in pancreata of KPC/Cdh11+/− mice in comparison to KPC/Cdh11+/+ (Supplementary Table 2). Importantly, the increase in CD4+, CD8a+ and CD19+ cells in KPC/Cdh11+/− tumors suggests their role in CDH11-mediated PDAC attenuation, which was further corroborated by the necessity of T and B cells for small molecule CDH11-inhibitor (SD133) efficacy.
Additionally, CAFs in Cdh11-deficient animals might acquire antigen-presenting properties. Indeed, hepatic and pancreatic stellate cells and other activated fibroblasts can serve as antigen-presenting cells.45,46 In some diseases, activated fibroblasts can directly regulate expansion and retention of T-regs in vitro47, while T-regs can negatively regulate antigen processing and presentation in dendritic cells48. Conversely, PKC-θ inhibits T-reg-mediated immunosuppression while it is required for effector T cell activation.33 Even though correlative, our data suggests that localization of FOXP3+ cells plays a role in mitigating tumor growth. Specifically, the reduced number of T-regs in the KPC/Cdh11+/− tumor center correlates with decreased fibroblast activation, increased expression of genes associated with antigen processing and presentation, and increased phosphorylation of PKC-θ and SLP-76, suggesting greater T cell activation downstream of the TCR complex33,34, and ultimately longer survival.
In our models, CDH11 is targeted in the whole animal, rather than specifically in a particular cell type. However, in post-embryonic life, CDH11 expression is largely restricted to activated fibroblasts, osteosarcomas and some invasive carcinomas.15,16,49–54 Specific targeting of activated fibroblasts in a particular organ is difficult, as these cells exist throughout the body. In PDAC, CDH11 is almost exclusively expressed by CAFs, and consequently we suggest that the effects of CDH11 deficiency or inhibition are mediated by CAFs. CDH11 protein may also be present in particular macrophage sub-types in other diseases55, but we did not observe this in PDAC (Figure 1H, Supplementary Figure 2). Since CDH11 could be cleaved and released from the cell surface similarly to E-cadherin,51,56 and it could activate growth factor receptors on other cells,57 CDH11 could potentially be taken up by macrophages, perhaps explaining the presence of protein but not RNA in these cells in other systems55. As CDH11 mAb and small molecule CDH11-inhibitor target the cell-to-cell adhesion pocket, it is likely that this region mediates both autonomous and non-autonomous actions.
The failure of CDH11 mAb (SYN0012) to attenuate mT3 tumor growth as a single agent could be attributed to difficulty in penetrating the dense PDAC fibrosis, and its modest affinity. The active site of CDH11 is unusually hydrophobic since it contains two tryptophan residues. This is useful for specificity as it serves to distinguish CDH11 from other cadherins, but such hydrophobic pockets are notoriously difficult to target with antibodies, which prefer surface-exposed charged regions.58 This makes development of small molecule CDH11-inhibitors, such as SD133 of high interest. Here, we did not observe a combinatorial effect of SD133 with gemcitabine (Figure 5F), perhaps because of the potency of SD133 alone or because it was only administered for 2 weeks. Clearly, the combination of gemcitabine with continuous SD133 administration is worth further exploration, as well as, additional investigations that combine anti-CDH11 therapeutics with non-PD1 pathway checkpoint inhibitors. While PD1 (PDCD1) expression in KPC/Cdh11+/− mice increased 1.8-fold (Supplementary Table 2), we detected a slight reduction (−1.3-fold) in PDL1 (CD274). Interferon γ, a major regulator of PDL1 levels in other systems,59 was also unaffected by Cdh11 deficiency. Hence, PDAC tumors in KPC/Cdh11-deficient animals may depend on non-PD1/PDL1 pathways, such as alternative inhibitory checkpoints. In future studies we propose to investigate the effect of CDH11 targeting ± gemcitabine in the KPC mouse model upon tumor detection to increase translational significance, since the improved survival of gemcitabine treated KPC/Cdh11-deficient mice observed in this study could be a result of treating earlier stage disease in 3-month-old KPC/Cdh11-deficient animals than in KPC/Cdh11+/+ mice.
In summary, CDH11 emerges as an excellent target for PDAC treatment, because it is not widely expressed in non-diseased tissues in post-embryonic life, but is highly expressed on activated fibroblasts in the stroma of PDAC patients. A marked survival advantage observed across several immunocompetent PDAC mouse models suggests that targeting CDH11 has a great potential for clinical translation. Even a 2.45-fold reduction in Cdh11 expression in KPC/Cdh11+/− animals, significantly increased survival, suggesting that complete disruption of CDH11 function is unnecessary, which bodes well for the development of CDH11-targeted therapy. The drug-like small molecule CDH11-inhibitor, SD133, is at an early stage in its pre-clinical development but was remarkably effective as a single agent, even on pre-existing tumors, with no sign of toxicity. Conversely, a CDH11 mAb in clinical trials for other indications was less effective as a monotherapy but yielded a significant combinatorial effect with gemcitabine and could feasibly be translated into the clinic.
Supplementary Material
What you need to know:
Background and Context:
Pancreatic ductal adenocarcinomas have a fibrotic, immunosuppressive microenvironment. Strategies to alter this microenvironment might help activate an anti-tumor immune response.
New Findings:
Cadherin 11, which is expressed by cancer-associated fibroblasts (CAFs) but not in normal pancreas, promoted immune tolerance to pancreatic tumors in mice. Loss or inhibition of cadherin 11 significantly extended survival of mice with pancreatic tumors by altering interactions between CAFs and immune cells, and restored sensitivity to gemcitabine.
Limitations:
This study reported an association between cadherin 11 expression and the anti-tumor immune response and survival of mice. Studies are needed to determine mechanisms by which anti-cadherin 11 therapeutics impact PDAC mouse models and humans.
Impact:
Strategies to inhibit cadherin 11 or its signaling pathways might be developed for treatment of pancreatic cancer.
Acknowledgments:
This research was supported by the Division of Comparative Medicine, and the following Shared Resources of the Georgetown Lombardi Comprehensive Cancer Center (NIH P30 CA051008); Animal Models, Genomics and Epigenomics, Histopathology and Tissue, Microscopy and Imaging, and Tissue Culture and Biobanking. The authors thank Dr. Marc Lippman (Georgetown University) for a critical review of the manuscript and Dr. Elizabeth Wheeler (Lawrence Livermore National Laboratory), Dr. Matthew Coleman (Lawrence Livermore National Laboratory) and Dr. Wei He (Lawrence Livermore National Laboratory) for resource sharing. A part of this work was performed under the auspices of the US Department of Energy by Lawrence Livermore National Laboratory under Contract DE-AC52-07NA27344. The authors thank Ming Yu, Han Lu, Bingqing Zhang, and Xiao-Jun Ma from Advanced Cell Diagnostics for providing reagents for RNAscope HiPlex Assays and fruitful discussions.
Grant Support:
This work was supported by 2017 AACR-AstraZeneca Fellowship in Immuno-oncology Research, grant 17-40-12-PERA (to Ivana Peran); The Ruesch Center for the Cure of Gastrointestinal Cancers grant award in 2016 (to Ivana Peran) and 2017 (to Ivana Peran, Shahin Assefnia, Stephen W. Byers, and Michael J. Pishvaian); the generous support of Mrs. Frances Schafer and the Partners in Research program donors (to Shahin Assefnia); American Cancer Society Institutional grant (to Shahin Assefnia); NIH R01 CA170653 (to Stephen W. Byers); NIH Cancer Center Support Grant P30 CA051008 (to Georgetown Lombardi Comprehensive Cancer Center); and Lawrence Livermore National Laboratory internal grant LDRD-19-SI-003 (to Aimy Sebastian, Nicholas R. Hum, Kelly A. Martin, and Gabriela G. Loots).
Abbreviations:
- CAF
cancer-associated fibroblasts
- CDH11
cadherin 11
- cDNA
complementary DNA
- DC
dendritic cells
- DMSO
dimethyl sulfoxide
- FBS
fetal bovine serum
- F.C
fold change
- FDA
The Food and Drug Administration
- H&E
hematoxylin and eosin
- IHC
immunohistochemistry
- IMC
imaging mass cytometry
- i.p
intraperitoneal(ly)
- KPC
p48-Cre;LSL-KrasG12D/+;LSL-Trp53R172H/+
- mAb
monoclonal antibody
- MDSC
myeloid-derived suppressive cell
- MTS
Masson’s trichrome staining
- NC
negative control
- NK
natural killer
- PanIN
pancreatic intraepithelial neoplasia
- PC
positive control
- PCR
polymerase chain reaction
- PDAC
pancreatic ductal adenocarcinoma
- PEG
polyethylene glycol
- PSC
pancreatic stellate cells
- RNAseq
RNA sequencing
- s.c
subcutaneous(ly)
- scRNAseq
single cell RNA sequencing
- SEM
standard error of the mean
- αSMA
alpha smooth muscle actin
- TCR
T cell receptor
- TLS
tertiary lymphoid structures
- TME
tumor microenvironment
- T-reg
T regulatory cell
- WB
Western blot
Footnotes
Publisher's Disclaimer: This is a PDF file of an unedited manuscript that has been accepted for publication. As a service to our customers we are providing this early version of the manuscript. The manuscript will undergo copyediting, typesetting, and review of the resulting proof before it is published in its final form. Please note that during the production process errors may be discovered which could affect the content, and all legal disclaimers that apply to the journal pertain.
Disclosures:
S.W.B. and S.D. have formed a company Diviner Therapeutics that has licensed cadherin 11 small molecule inhibitor patents from Georgetown University. A.M., B.A., and A.A.Q. are employees of, and receive remuneration from Fluidigm Corporation. Other authors declare no potential conflict of interest.
References
- 1.Rahib L, Smith BD, Aizenberg R, et al. Projecting cancer incidence and deaths to 2030: the unexpected burden of thyroid, liver, and pancreas cancers in the United States. Cancer Res 2014;74:2913–2921. [DOI] [PubMed] [Google Scholar]
- 2.Conroy T, Desseigne F, Ychou M, et al. FOLFIRINOX versus gemcitabine for metastatic pancreatic cancer. N Engl J Med 2011;364:1817–1825. [DOI] [PubMed] [Google Scholar]
- 3.Von Hoff DD, Ervin T, Arena FP, et al. Increased survival in pancreatic cancer with nab-paclitaxel plus gemcitabine. N Engl J Med 2013;369:1691–1703. [DOI] [PMC free article] [PubMed] [Google Scholar]
- 4.American Cancer Society. Cancer Facts & Figures 2020. Atlanta: American Cancer Society; 2020:1–76. [Google Scholar]
- 5.Hu ZI, Shia J, Stadler ZK, et al. Evaluating mismatch repair deficiency in pancreatic adenocarcinoma: Challenges and recommendations. Clin Cancer Res 2018;24:1326–1336. [DOI] [PMC free article] [PubMed] [Google Scholar]
- 6.Erkan M, Hausmann S, Michalski CW, et al. The role of stroma in pancreatic cancer: diagnostic and therapeutic implications. Nat Rev Gastroenterol Hepatol 2012;9:454–467. [DOI] [PubMed] [Google Scholar]
- 7.Blando J, Sharma A, Higa MG, et al. Comparison of immune infiltrates in melanoma and pancreatic cancer highlights VISTA as a potential target in pancreatic cancer. Proc Natl Acad Sci U S A 2019;116:1692–1697. [DOI] [PMC free article] [PubMed] [Google Scholar]
- 8.Stromnes IM, Hulbert A, Pierce RH, et al. T-cell localization, activation, and clonal expansion in human pancreatic ductal adenocarcinoma. Cancer Immunol Res 2017;5:978–991. [DOI] [PMC free article] [PubMed] [Google Scholar]
- 9.Vonderheide RH, Bayne LJ. Inflammatory networks and immune surveillance of pancreatic carcinoma. Curr Opin Immunol 2013;25:200–205. [DOI] [PMC free article] [PubMed] [Google Scholar]
- 10.Zhang Y, Lazarus J, Steele NG, et al. Regulatory T cell depletion alters the tumor microenvironment and accelerates pancreatic carcinogenesis. Cancer Discov 2020:CD–19–0958. [DOI] [PMC free article] [PubMed] [Google Scholar]
- 11.Vennin C, Murphy KJ, Morton JP, et al. Reshaping the tumor stroma for treatment of pancreatic cancer. Gastroenterology 2018;154:820–838. [DOI] [PubMed] [Google Scholar]
- 12.Sasson AR, Wetherington RW, Hoffman JP, et al. Neoadjuvant chemoradiotherapy for adenocarcinoma of the pancreas. Int J Gastrointest Canc 2003;34:121–127. [DOI] [PubMed] [Google Scholar]
- 13.Iacobuzio-Donahue CA, Maitra A, Shen-Ong GL, et al. Discovery of novel tumor markers of pancreatic cancer using global gene expression technology. Am J Pathol 2002;160:1239–1249. [DOI] [PMC free article] [PubMed] [Google Scholar]
- 14.Binkley CE, Zhang L, Greenson JK, et al. The molecular basis of pancreatic fibrosis: common stromal gene expression in chronic pancreatitis and pancreatic adenocarcinoma. Pancreas 2004;29:254–263. [DOI] [PubMed] [Google Scholar]
- 15.Assefnia S, Dakshanamurthy S, Guidry Auvil JM, et al. Cadherin-11 in poor prognosis malignancies and rheumatoid arthritis: common target, common therapies. Oncotarget 2014;5:1458–1474. [DOI] [PMC free article] [PubMed] [Google Scholar]
- 16.Chang SK, Noss EH, Chen M, et al. Cadherin-11 regulates fibroblast inflammation. Proc Natl Acad Sci U S A 2011;108:8402–8407. [DOI] [PMC free article] [PubMed] [Google Scholar]
- 17.Costello CM, Mah N, Häsler R, et al. Dissection of the inflammatory bowel disease transcriptome using genome-wide cDNA microarrays. PLoS Med 2005;2:e199. [DOI] [PMC free article] [PubMed] [Google Scholar]
- 18.Schneider DJ, Wu M, Le TT, et al. Cadherin-11 contributes to pulmonary fibrosis: potential role in TGF-β production and epithelial to mesenchymal transition. FASEB J 2012;26:503–512. [DOI] [PMC free article] [PubMed] [Google Scholar]
- 19.Wu M, Pedroza M, Lafyatis R, et al. Identification of cadherin 11 as a mediator of dermal fibrosis and possible role in systemic sclerosis. Arthritis Rheumatol 2014;66:1010–1021. [DOI] [PMC free article] [PubMed] [Google Scholar]
- 20.Schroer AK, Bersi MR, Clark CR, et al. Cadherin-11 blockade reduces inflammation-driven fibrotic remodeling and improves outcomes after myocardial infarction. JCI Insight 2019;4:e67. [DOI] [PMC free article] [PubMed] [Google Scholar]
- 21.Horikawa K, Radice G, Takeichi M, et al. Adhesive subdivisions intrinsic to the epithelial somites. Dev Biol 1999;215:182–189. [DOI] [PubMed] [Google Scholar]
- 22.Hingorani SR, Wang L, Multani AS, et al. Trp53R172H and KrasG12D cooperate to promote chromosomal instability and widely metastatic pancreatic ductal adenocarcinoma in mice. Cancer Cell 2005;7:469–483. [DOI] [PubMed] [Google Scholar]
- 23.Boj SF, Hwang C-I, Baker LA, Chio IIC, Engle DD, Corbo V, Jager M, et al. Organoid models of human and mouse ductal pancreatic cancer. Cell 2015;160:324–338. [DOI] [PMC free article] [PubMed] [Google Scholar]
- 24.Chang Q, Ornatsky OI, Siddiqui I, et al. Biodistribution of cisplatin revealed by imaging mass cytometry identifies extensive collagen binding in tumor and normal tissues. Sci Rep 2016;6:36641–11. [DOI] [PMC free article] [PubMed] [Google Scholar]
- 25.Badea L, Herlea V, Dima SO, et al. Combined gene expression analysis of whole-tissue and microdissected pancreatic ductal adenocarcinoma identifies genes specifically overexpressed in tumor epithelia. Hepatogastroenterology 2008;55:2016–2027. [PubMed] [Google Scholar]
- 26.Iacobuzio-Donahue CA, Maitra A, Olsen M, et al. Exploration of global gene expression patterns in pancreatic adenocarcinoma using cDNA microarrays. Am J Pathol 2003;162:1151–1162. [DOI] [PMC free article] [PubMed] [Google Scholar]
- 27.Logsdon CD, Simeone DM, Binkley C, et al. Molecular profiling of pancreatic adenocarcinoma and chronic pancreatitis identifies multiple genes differentially regulated in pancreatic cancer. Cancer Res 2003;63:2649–2657. [PubMed] [Google Scholar]
- 28.Pei H, Li L, Fridley BL, et al. FKBP51 affects cancer cell response to chemotherapy by negatively regulating Akt. Cancer Cell 2009;16:259–266. [DOI] [PMC free article] [PubMed] [Google Scholar]
- 29.Segara D, Biankin AV, Kench JG, et al. Expression of HOXB2, a retinoic acid signaling target in pancreatic cancer and pancreatic intraepithelial neoplasia. Clin Cancer Res 2005; 11:3587–3596. [DOI] [PubMed] [Google Scholar]
- 30.Biffi G, Oni TE, Spielman B, et al. IL-1-induced JAK/STAT signaling is antagonized by TGF-beta to shape CAF heterogeneity in pancreatic ductal adenocarcinoma. Cancer Discov 2018:CD–18–0710. [DOI] [PMC free article] [PubMed] [Google Scholar]
- 31.Bowen CJ, Zhou J, Sung DC, et al. Cadherin-11 coordinates cellular migration and extracellular matrix remodeling during aortic valve maturation. Dev Biol 2015;407:145–157. [DOI] [PMC free article] [PubMed] [Google Scholar]
- 32.Ondondo B, Jones E, Godkin A, et al. Home sweet home: the tumor microenvironment as a haven for regulatory T cells. Front Immunol 2013;4:197. [DOI] [PMC free article] [PubMed] [Google Scholar]
- 33.Zanin-Zhorov A, Ding Y, Kumari S, et al. Protein kinase C-theta mediates negative feedback on regulatory T cell function. Science 2010;328:372–376. [DOI] [PMC free article] [PubMed] [Google Scholar]
- 34.Koretzky GA, Abtahian F, Silverman MA. SLP76 and SLP65: complex regulation of signalling in lymphocytes and beyond. Nat Rev Immunol 2006;6:67–78. [DOI] [PubMed] [Google Scholar]
- 35.Griffith JW, Sokol CL, Luster AD. Chemokines and chemokine receptors: positioning cells for host defense and immunity. Annu Rev Immunol 2014;32:659–702. [DOI] [PubMed] [Google Scholar]
- 36.Heng TSP, Painter MW, Immunological Genome Project Consortium. The Immunological Genome Project: networks of gene expression in immune cells. Nat Immunol 2008;9:1091–1094. [DOI] [PubMed] [Google Scholar]
- 37.Sohal DPS, Kennedy EB, Khorana A, et al. Metastatic pancreatic cancer: ASCO clinical practice guideline update. J Clin Oncol 2018;36:2545–2556. [DOI] [PMC free article] [PubMed] [Google Scholar]
- 38.Vazquez MI, Catalan-Dibene J, Zlotnik A. B cells responses and cytokine production are regulated by their immune microenvironment. Cytokine 2015;74:318–326. [DOI] [PMC free article] [PubMed] [Google Scholar]
- 39.Putoczki TL, Thiem S, Loving A, et al. Interleukin-11 is the dominant IL-6 family cytokine during gastrointestinal tumorigenesis and can be targeted therapeutically. Cancer Cell 2013;24:257–271. [DOI] [PubMed] [Google Scholar]
- 40.Kondo S, Ueno H, Hosoi H, et al. Clinical impact of pentraxin family expression on prognosis of pancreatic carcinoma. Br J Cancer 2013;109:739–746. [DOI] [PMC free article] [PubMed] [Google Scholar]
- 41.Bello G, Cailotto F, Hanriot D, et al. C-reactive protein (CRP) increases VEGF-A expression in monocytic cells via a PI3-kinase and ERK 1/2 signaling dependent pathway. Atherosclerosis 2008;200:286–293. [DOI] [PubMed] [Google Scholar]
- 42.Tjomsland V, Spångeus A, Välilä J, et al. Interleukin 1α sustains the expression of inflammatory factors in human pancreatic cancer microenvironment by targeting cancer-associated fibroblasts. Neoplasia 2011;13:664–675. [DOI] [PMC free article] [PubMed] [Google Scholar]
- 43.Chang SK, Kohlgruber AC, Mizoguchi F, et al. Stromal cell cadherin-11 regulates adipose tissue inflammation and diabetes. J Clin Invest 2017;127:3300–3312. [DOI] [PMC free article] [PubMed] [Google Scholar]
- 44.Row S, Liu Y, Alimperti S, et al. Cadherin-11 is a novel regulator of extracellular matrix synthesis and tissue mechanics. J Cell Sci 2016;129:2950–2961. [DOI] [PMC free article] [PubMed] [Google Scholar]
- 45.Winau F, Hegasy G, Weiskirchen R, et al. Ito cells are liver-resident antigen-presenting cells for activating T cell responses. Immunity 2007;26:117–129. [DOI] [PubMed] [Google Scholar]
- 46.Elyada E, Bolisetty M, Laise P, et al. Cross-species single-cell analysis of pancreatic ductal adenocarcinoma reveals antigen-presenting cancer-associated fibroblasts. Cancer Discov 2019;9:1102–1123. [DOI] [PMC free article] [PubMed] [Google Scholar]
- 47.Dangi A, Sumpter TL, Kimura S, et al. Selective expansion of allogeneic regulatory T cells by hepatic stellate cells: role of endotoxin and implications for allograft tolerance. J Immunol 2012;188:3667–3677. [DOI] [PMC free article] [PubMed] [Google Scholar]
- 48.Jang J-E, Hajdu CH, Liot C, et al. Crosstalk between regulatory T cells and tumor-associated dendritic cells negates anti-tumor immunity in pancreatic cancer. Cell Rep 2017;20:558–571. [DOI] [PMC free article] [PubMed] [Google Scholar]
- 49.Kashima T, Kawaguchi J, Takeshita S, et al. Anomalous cadherin expression in osteosarcoma. Possible relationships to metastasis and morphogenesis. Am J Pathol 1999;155:1549–1555. [DOI] [PMC free article] [PubMed] [Google Scholar]
- 50.Pishvaian MJ, Feltes CM, Thompson P, et al. Cadherin-11 is expressed in invasive breast cancer cell lines. Cancer Res 1999;59:947–952. [PubMed] [Google Scholar]
- 51.Feltes CM, Kudo A, Blaschuk O, et al. An alternatively spliced cadherin-11 enhances human breast cancer cell invasion. Cancer Res 2002;62:6688–6697. [PubMed] [Google Scholar]
- 52.Tomita K, van Bokhoven A, van Leenders GJ, et al. Cadherin switching in human prostate cancer progression. Cancer Res 2000;60:3650–3654. [PubMed] [Google Scholar]
- 53.Shibata T, Ochiai A, Gotoh M, et al. Simultaneous expression of cadherin-11 in signet-ring cell carcinoma and stromal cells of diffuse-type gastric cancer. Cancer Lett 1996;99:147–153. [DOI] [PubMed] [Google Scholar]
- 54.Sebastian A, Hum NR, Martin KA, et al. Single-cell transcriptomic analysis of tumor-derived fibroblasts and normal tissue-resident fibroblasts reveals fibroblast heterogeneity in breast cancer. Cancers 2020;12:1307. [DOI] [PMC free article] [PubMed] [Google Scholar]
- 55.Lodyga M, Cambridge E, Karvonen HM, et al. Cadherin-11-mediated adhesion of macrophages to myofibroblasts establishes a profibrotic niche of active TGF-β. Sci Signal 2019;12:eaao3469. [DOI] [PubMed] [Google Scholar]
- 56.Brouxhon SM, Kyrkanides S, Teng X, et al. Monoclonal antibody against the ectodomain of E-cadherin (DECMA-1) suppresses breast carcinogenesis: involvement of the HER/PI3K/Akt/mTOR and IAP pathways. Clin Cancer Res 2013;19:3234–3246. [DOI] [PMC free article] [PubMed] [Google Scholar]
- 57.Madarampalli B, Watts GFM, Panipinto PM, et al. Interactions between cadherin-11 and platelet-derived growth factor receptor-alpha signaling link cell adhesion and proliferation. Biochim Biophys Acta Mol Basis Dis 2019;1865:1516–1524. [DOI] [PMC free article] [PubMed] [Google Scholar]
- 58.Patel SD, Ciatto C, Chen CP, Bahna F, Rajebhosale M, et al. Type II cadherin ectodomain structures: implications for classical cadherin specificity. Cell 2006;124:1255–1268. [DOI] [PubMed] [Google Scholar]
- 59.Garcia-Diaz A, Shin DS, Moreno BH, et al. Interferon receptor signaling pathways regulating PD-L1 and PD-L2 expression. Cell Rep 2017;19:1189–1201. [DOI] [PMC free article] [PubMed] [Google Scholar]
Associated Data
This section collects any data citations, data availability statements, or supplementary materials included in this article.