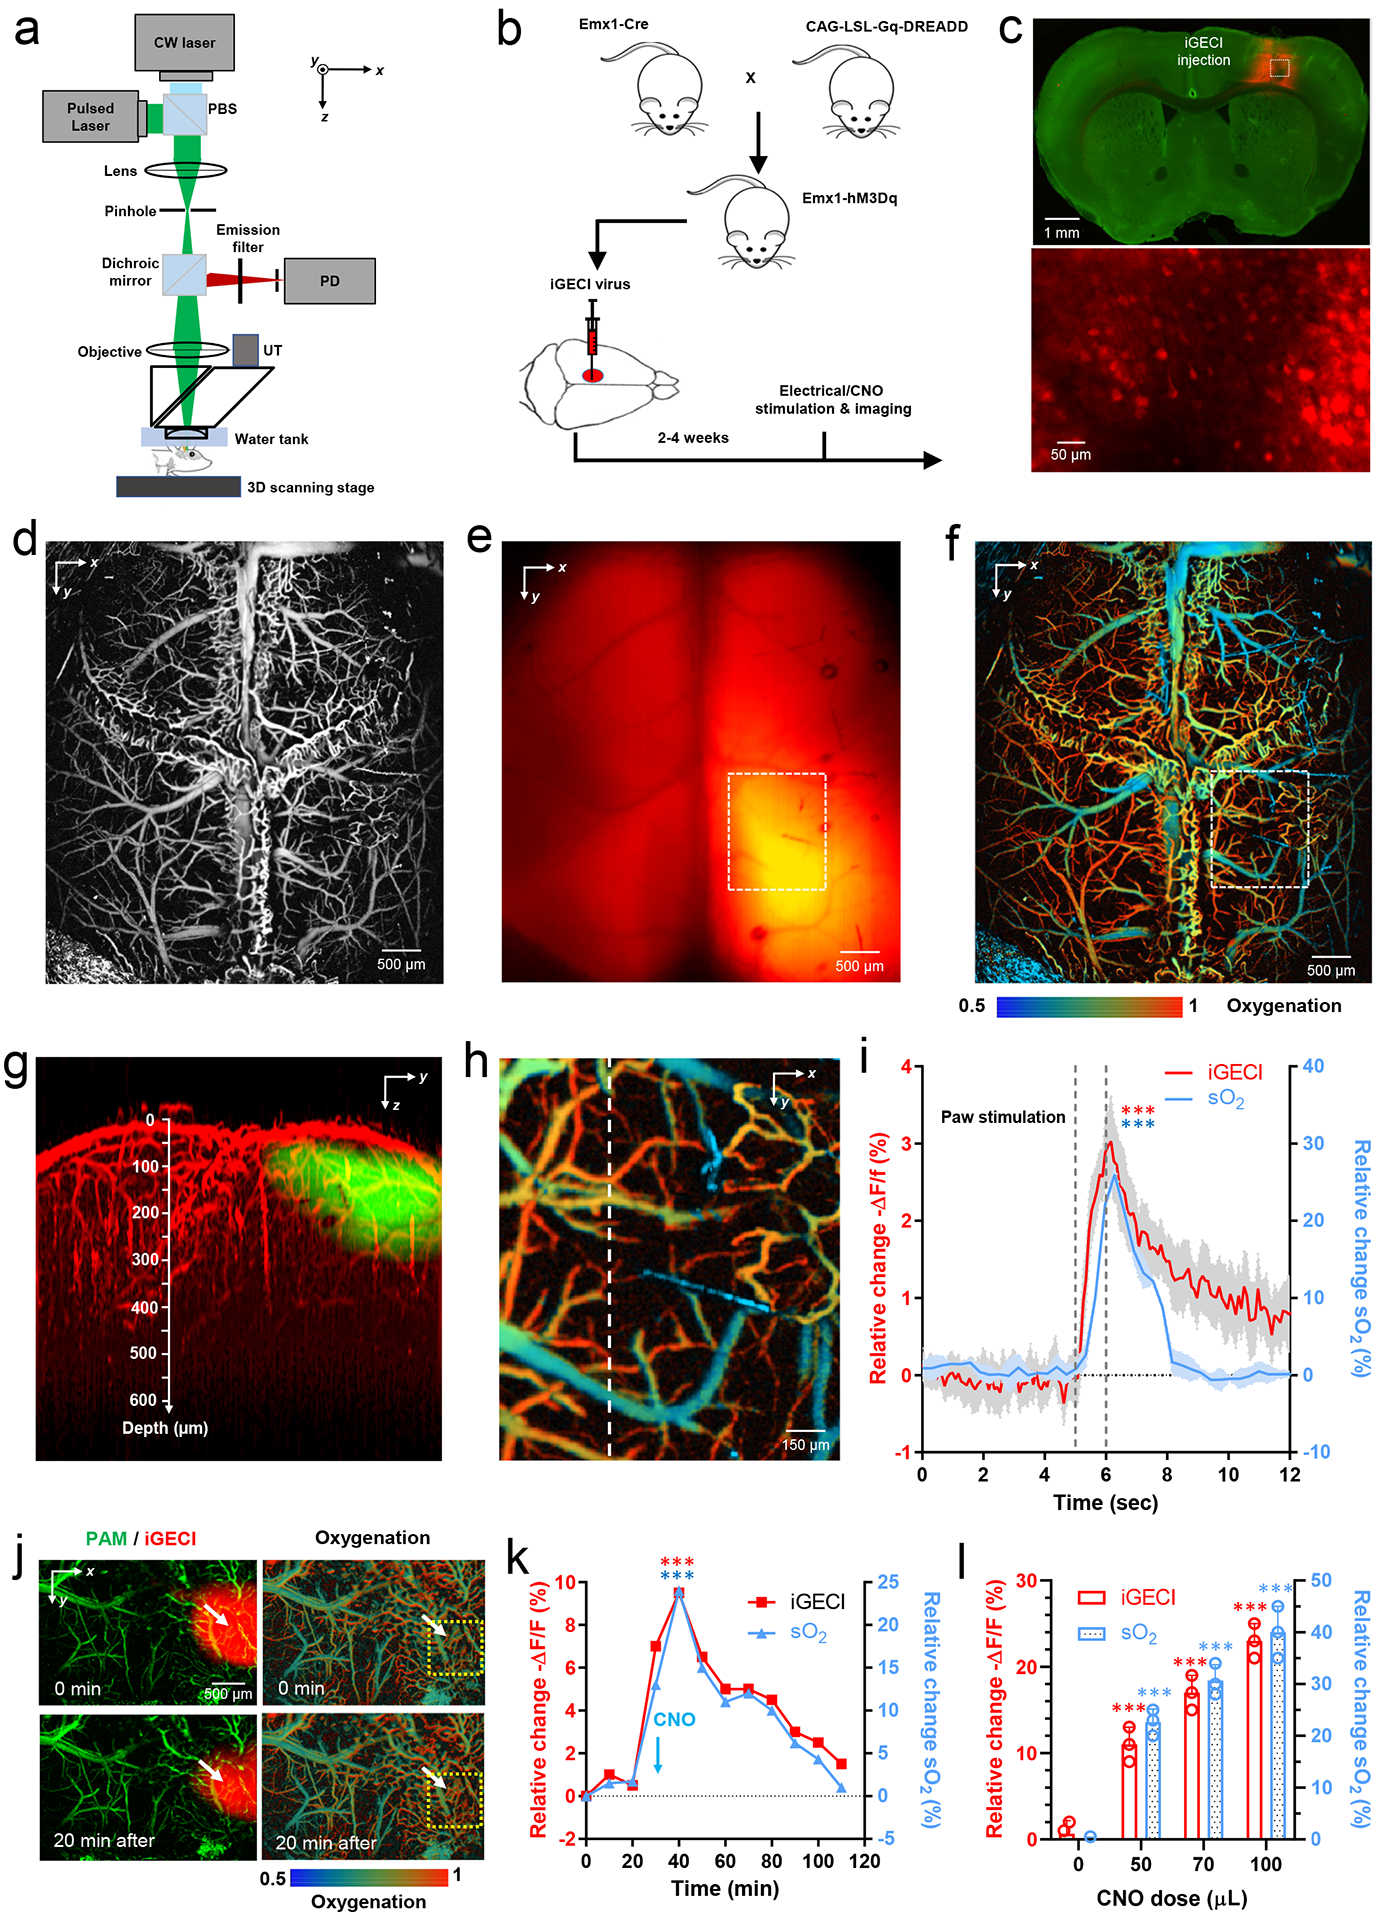
Figure 5. In vivo imaging of iGECI using hybrid photoacoustic and fluorescence microscopy.

(a) Hybrid photoacoustic and fluorescence microscopy. PBS, polarizing beam splitter; PD, photodiode; UT, ultrasonic transducer. (b) Transgenic mouse cross that expresses an excitatory hM3Dq DREADD in the forebrain pyramidal neurons. Clozapine-N-oxide (CNO) can be administered to enhance neuronal firing. (c) Fluorescence images of the mouse brain slice, showing the full-view iGECI expression (top, red) and iGECI-expressing neurons (bottom). (d-e) In vivo hybrid photoacoustic image of the brain vasculature (d) and fluorescence image of the iGECI expression (e) through the intact skull. (f) In vivo photoacoustic imaging of the blood oxygenation. (g) Depth projection of overlaid PAM and fluorescence images, showing a ~600 μm penetration depth. (h) A close-up image of the dashed region in (f), showing the oxygenation of the cortical hindlimb region. Data shown in (c-h) are representative of three independent experiments with similar results. (i) Oxygenation and calcium responses to electrical stimulations of the mouse left hindlimb. Time traces of the averaged iGECI signals (-ΔF/F) and blood oxygenation (sO2) along the dashed line, across the region shown in (h). The stimulation lasted for 1 s. n=4 biologically independent mice. Shaded area: ±SEM. *** p value <0.001; paired two-sided student’s t-test; Exact p values: iGECI, 0.000323; sO2, 0.000275. (j) Simultaneous imaging of the iGECI (left, red) and blood oxygenation (right) before and 20 min after i.p. injection of indicated volume of CNO (1 μg/ml). (k) Time traces of the averaged iGECI signals (-ΔF/F) and sO2 within the yellow dashed circle in (j), following i.p. injection of CNO. Data in (j) and (k) are representative of three independent experiments with similar results. *** p value <0.001; paired two-sided student’s t-test. Exact p values: iGECI, 0.000148; sO2, 0.000836. (l) The peak changes in iGECI signals (-ΔF/F) and sO2 with different CNO doses. n=3 biologically independent mice at each dose. *** p value <0.001; paired two-sided student’s t-test. Exact p values: iGECI for dose 50, 70, 100 μL, 0.000317, 0.000538, 0.000791, respectively; sO2 for dose 50, 70, 100 μL, 0.000874, 0.000683, 0.000592, respectively. In all experiments, no exogenous BV was supplied.
