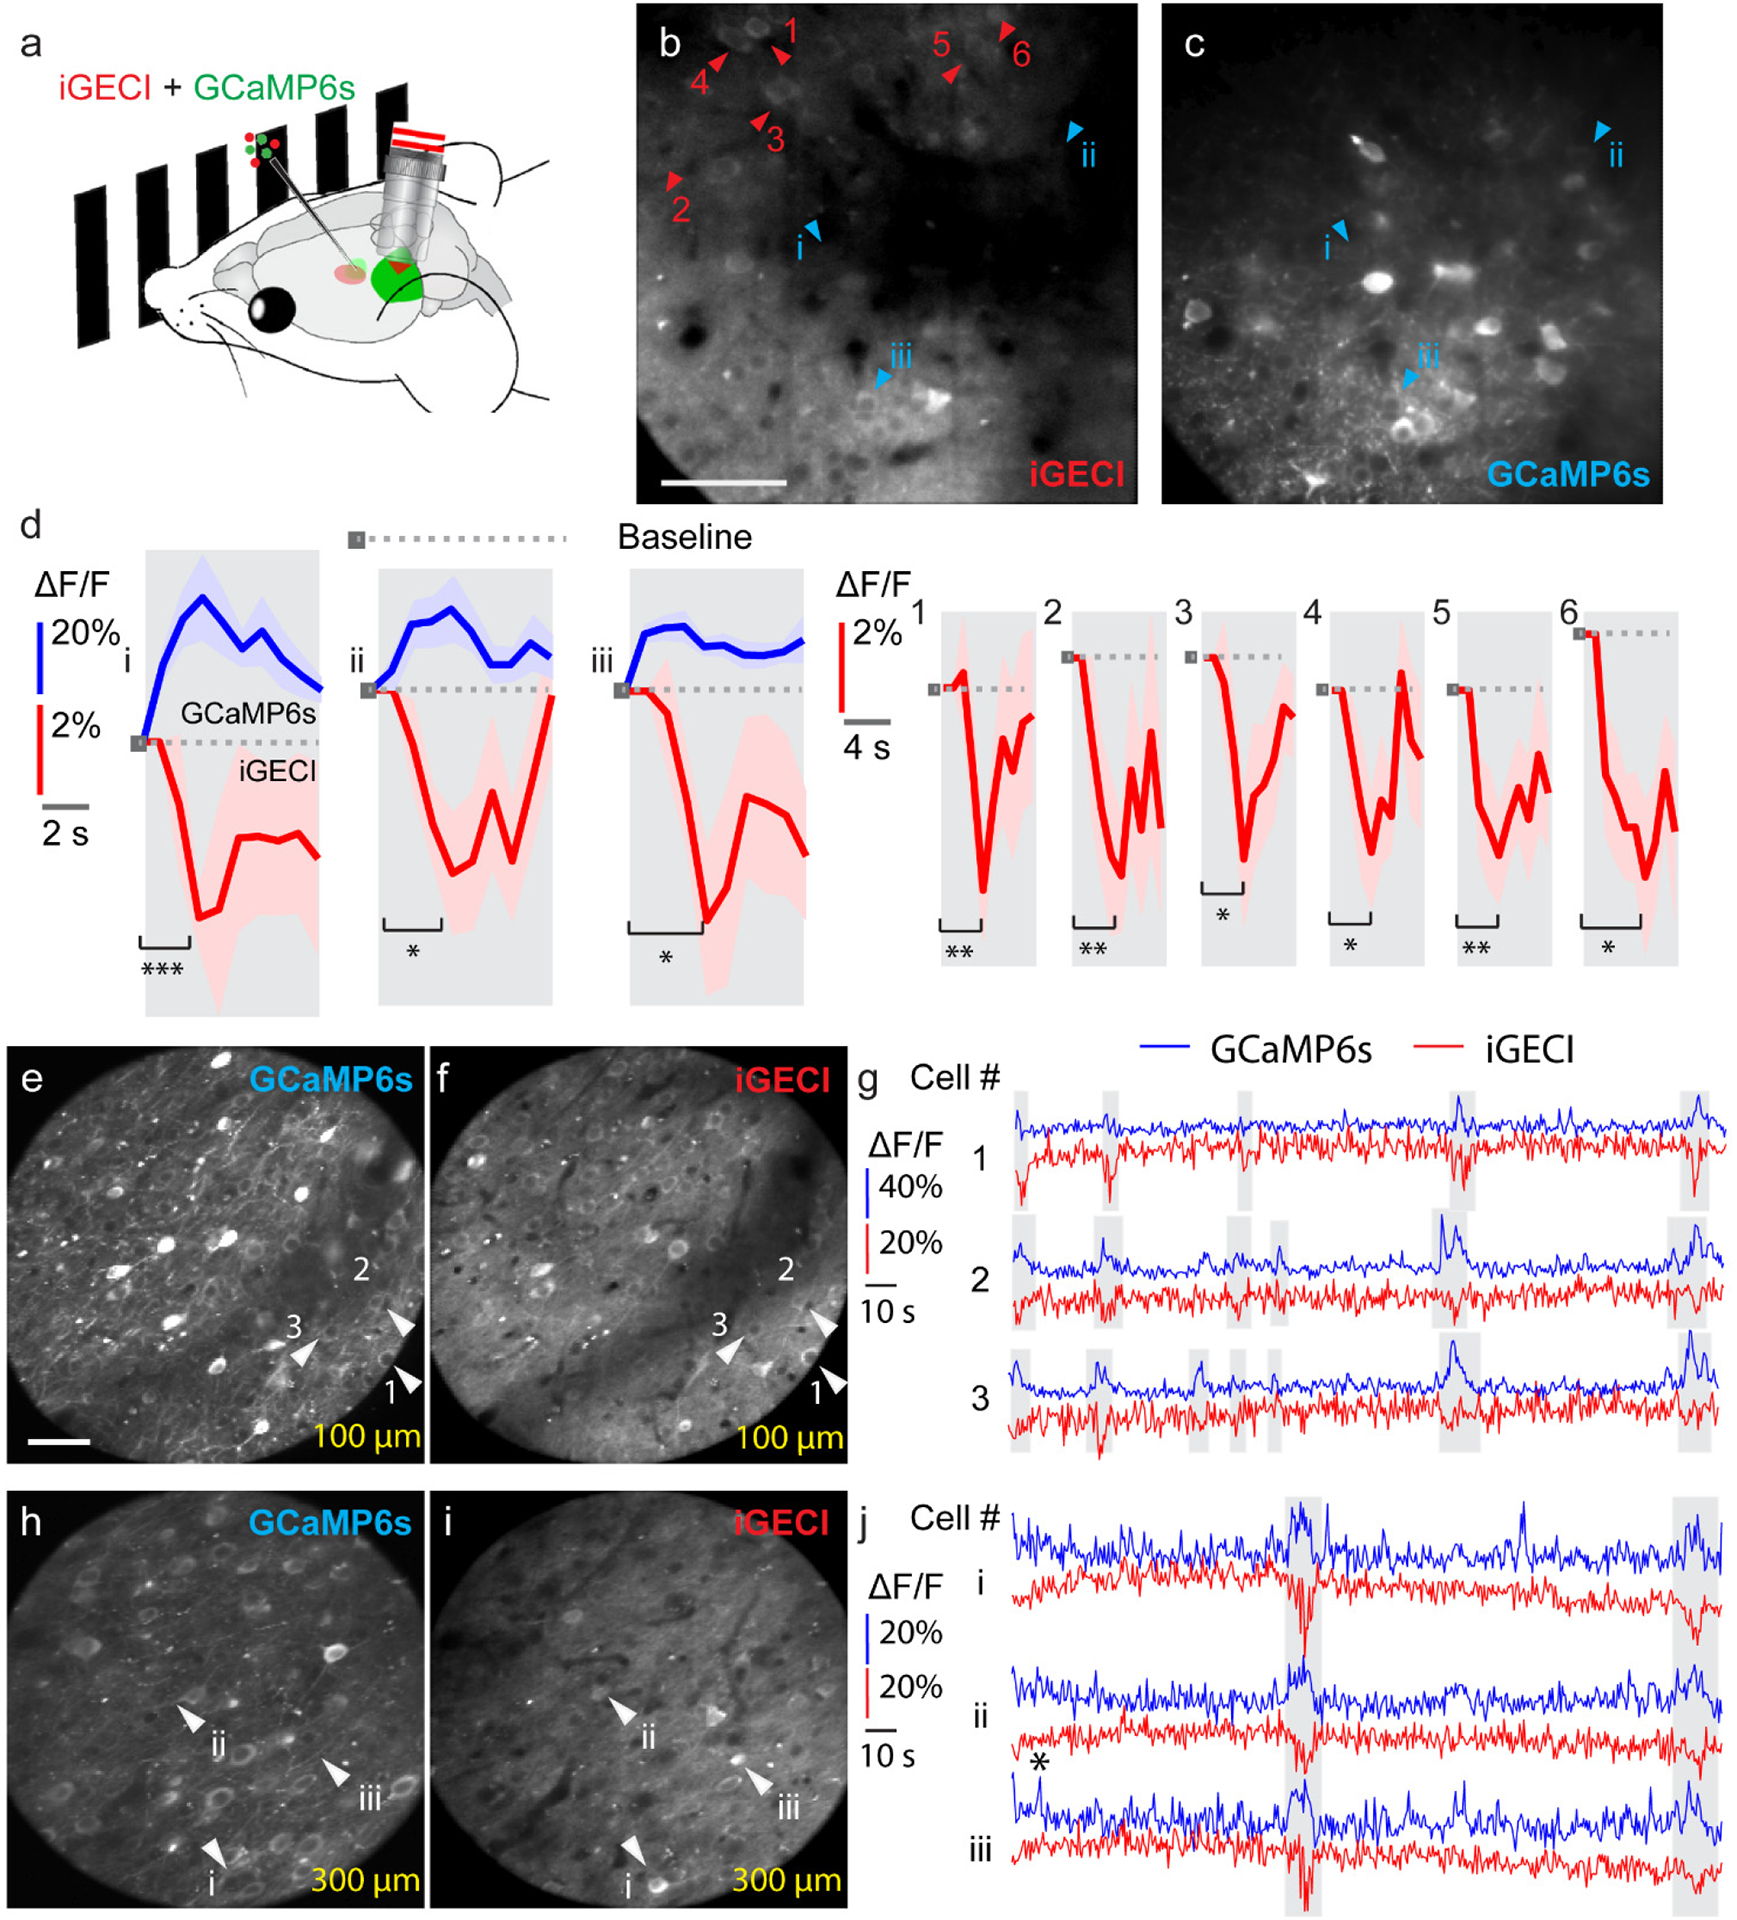
Figure 6. iGECI reports visually evoked and spontaneous neuronal activity in vivo.

(a) Schematics of the in vivo calcium imaging experiments with visual stimulation on head-fixed awake mice. (b, c) Two-photon fluorescence images (256 × 256 pixels at 1 μm pixel size) of the same neurons in the mouse primary visual cortex transfected with iGECI and GCaMP6s. Images were acquired simultaneously at 200 μm below dura. Scale bar, 50 μm. (d) Example ΔF/F calcium transients (10-trial average) for neurons co-expressing GCaMP6s and iGECI (left panel, i-iii) and neurons only expressing iGECI (right panel, 1–6). Shaded area: ±SEM. * p value<0.05; ** p value<0.01; *** p value<0.001; paired two-sided student’s t-test. Exact p values (cells i-iii): 0.000451, 0.0135, and 0.0146; (cells 1–6): 0.00280, 0.00368, 0.0133, 0.0188, 0.00721, and 0.0108. Data are representative of five independent experiments with similar results. (e-f, h-i) Two-photon fluorescence images (225 × 225 pixels at 1.5 μm pixel size) of neurons in the mouse primary visual cortex at (e, f) 100 μm and (h, i) 300 μm below dura. Scale bar: 50 μm. (g, j) Example ΔF/F calcium transients for neurons co-expressing GCaMP6s and iGECI at 100 μm (1–3 in (e, f), white arrowheads) and 300 μm (i-iii in h, i, white arrowheads). Data are from one experiment. In all experiments, no exogenous BV was supplied.
