
Fig. 3. Role of pharmacological inhibition of ALDH2 activity in Ang II-mediated angiogenesis and mRNA/protein levels of 4HNE-protein adducts, VEGFR1, VEGFR2 and AT2R in MCECs.
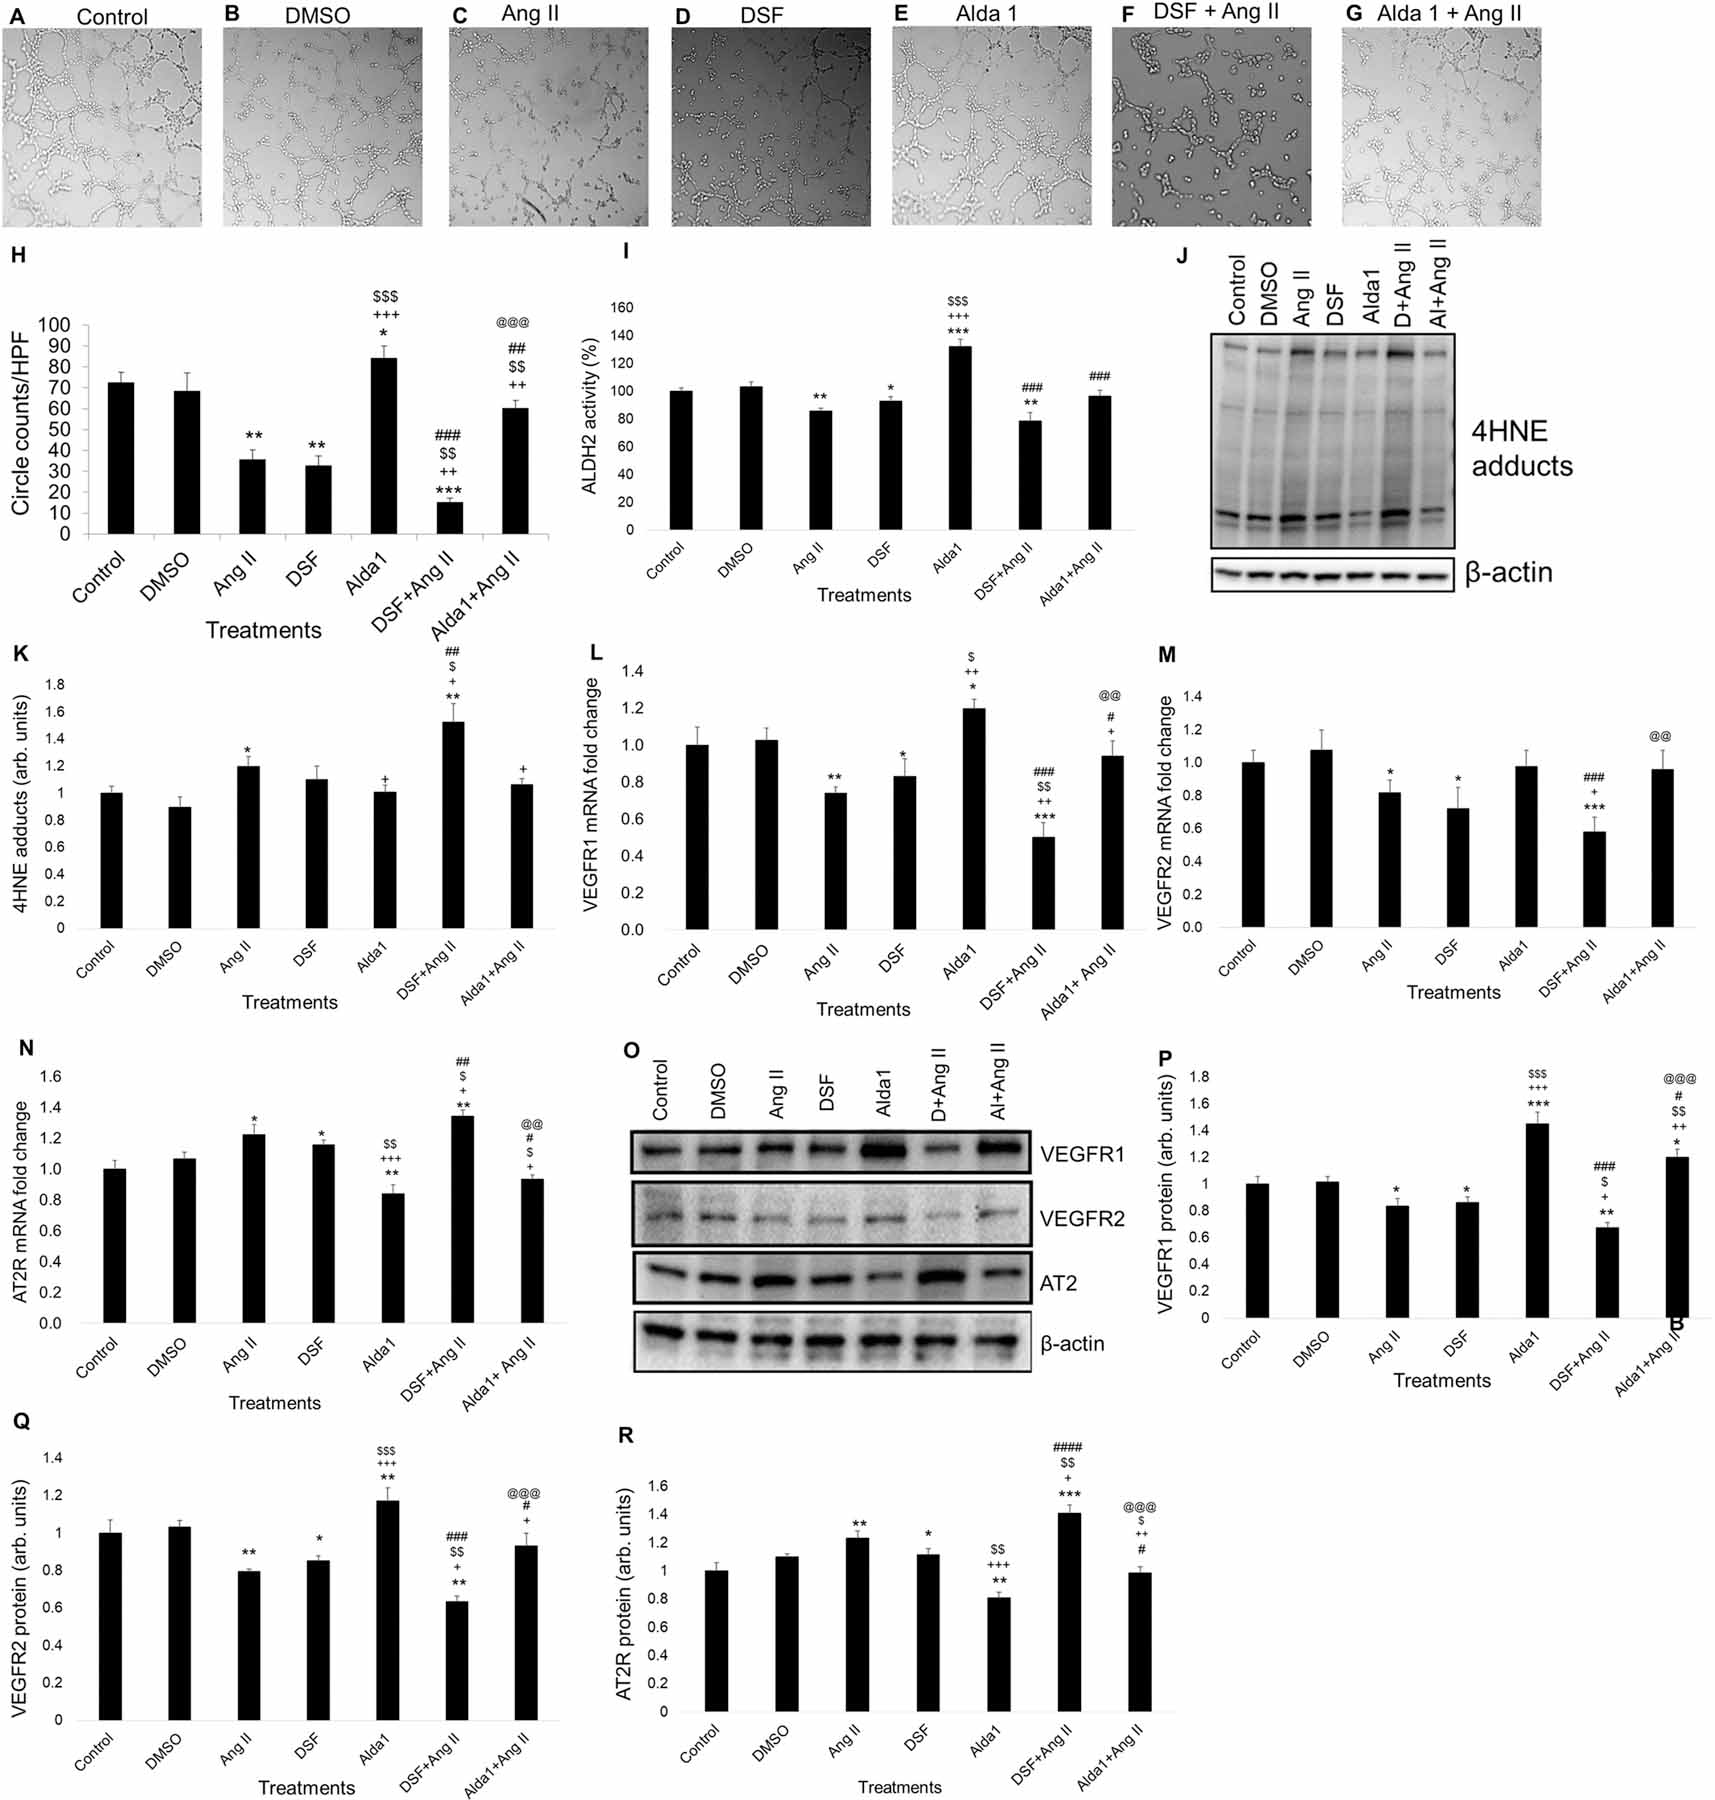
(A) - (G) Representative micrographs of tube formation on Matrigel after 1 h of DSF (2.5 μM) /Alda1 (10 μM) treatments followed by 2 h of Ang II (10 μM) treatment. Magnification: 10x. A to E show tube formation with control, DMSO (vehicle), Ang II (10 μM), DSF (2.5 μM) and Alda 1 (10 μM)-treated MCECs. F shows tube formation with DSF pretreatment followed by Ang II treatment. G shows tube formation with Alda 1 pretreatment followed by Ang II treatment. (H) Quantitative data of circles with different treatments stated in A through G. (I) Quantitative data of ALDH2 activity in MCECs after 1 h of DSF (2.5 μM) /Alda1 (10 μM) treatments following 2 h of Ang II (10 μM) treatment. (J) Representative WB band image of 4HNE protein adducts after 1 h of DSF (2.5 μM) /Alda1 (10 μM) treatments following 2 h of Ang II (10 μM) treatment. (K) Quantification of WB data in panel J. (L) Representative qPCR data of VEGFR1 mRNA expression after 2 h. (M) Representative qPCR data of VEGFR2 mRNA expression after 2 h. (N) Representative qPCR data of AT2R mRNA expression after 2 h. (O) Representative Western blot (WB) band images of VEGFR1, VEGFR2, AT2R and β-actin proteins in MCECs after 1 h of DSF (2.5 μM) /Alda1 (10 μM) treatments followed by 2 h of Ang II (10 μM) treatment. (P) Quantification of WB data of VEGFR1 protein levels stated in panel O. (Q) Quantification of WB data of VEGFR2 protein levels stated in panel O. (R) Quantification of WB data of AT2R protein levels stated in panel O. n=6 for each group. Each bar represents mean ± SEM. *p < .05 vs control, **p < .005 vs control, ***p < .0005 vs control, +p < .05 vs Ang II, ++p < .005 vs Ang II, +++p < .0005 vs Ang II, $p < .05 vs DSF, $ $p < .005 vs DSF, $ $ $p < .0005 vs DSF, #p < .05 vs Alda 1, ##p < .005 vs Alda 1, ###p < .0005 vs Alda 1, ####p < .0001 vs Alda 1, @@p < .005 vs DSF+Ang II and @@@p < .0005 vs DSF+Ang II. HPF = high power field, Ang II = Angiotensin II and DSF = disulfiram.