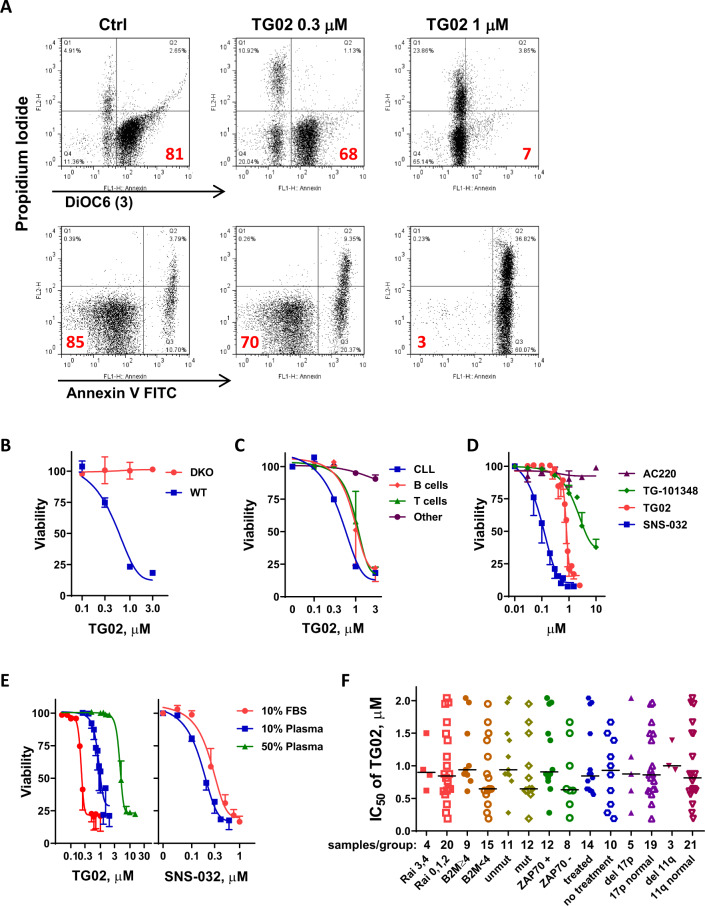
Fig. 1. TG02-induced apoptosis in the primary CLL cells.
A TG02-induced loss of mitochondrial membrane potential and apoptosis in the CLL cells. A representative flow image is shown. Top panel: Loss of mitochondrial membrane potential measured by DiOC6(3) and PI double staining, numbers in the lower right quadrant indicate percentage of cells that have intact mitochondrial membrane; Bottom Panel: Analysis of apoptosis by annexin V-FITC/PI double staining. The percentages of live cells (Annexin-/PI-) are shown in the lower-left quadrant. B TG02-induced cell death was dependent on BAX/BAK expression. The cytotoxicity of TG02 at 24 h was compared between wild-type MEF cells (◾) and cells with BAX and BAK double knockout (●). Cell death was measured by Annexin V/PI staining followed by flow cytometry and normalized to DMSO-treated controls. Data represent the mean ± SD of measurements performed in triplicates. C Comparison of TG02 toxicity for CLL cells relative to normal B and T cells from healthy donors. Cell death (mean ± SEM) was compared after 24 h incubation with TG02 in CLL cells (n = 3,◾) and normal B cells (♦), T cells (▴) cells and other cells (neither B nor T, ●) from healthy donors (n = 3). D Dose-dependent induction of cell death was compared among SNS-032 (◾, n = 6), TG02 (●, n = 10), TG-101348 (♦, n = 7) and AC220 (▴, n = 3) after 24 h incubation. Data represent the mean ± SEM. E. Plasma proteins reduced the potency of TG02. Left: the dose responses to TG02 at 24 h were compared in CLL cells incubated in RPMI with 10% FBS (●), 10% human plasma (◾) or 50% human plasma (▴). As a control, the dose responses to SNS-032 were compared in 10% FBS (●) or 10% human plasma (◾) (right). Data represent the mean viability ± SEM of 3 samples. F. Toxicity of TG02 is independent of CLL prognostic factors. IC50 values of TG02 after 24 h incubation were compared in 24 CLL samples with either inferior or favorable prognosis, or previous treatment history. The line in the scatter plot showed median IC50 values of each group. The number of samples in each group was shown below the plot. None of the comparisons was significant according to Mann–Whitney test (p values greater than 0.05).

