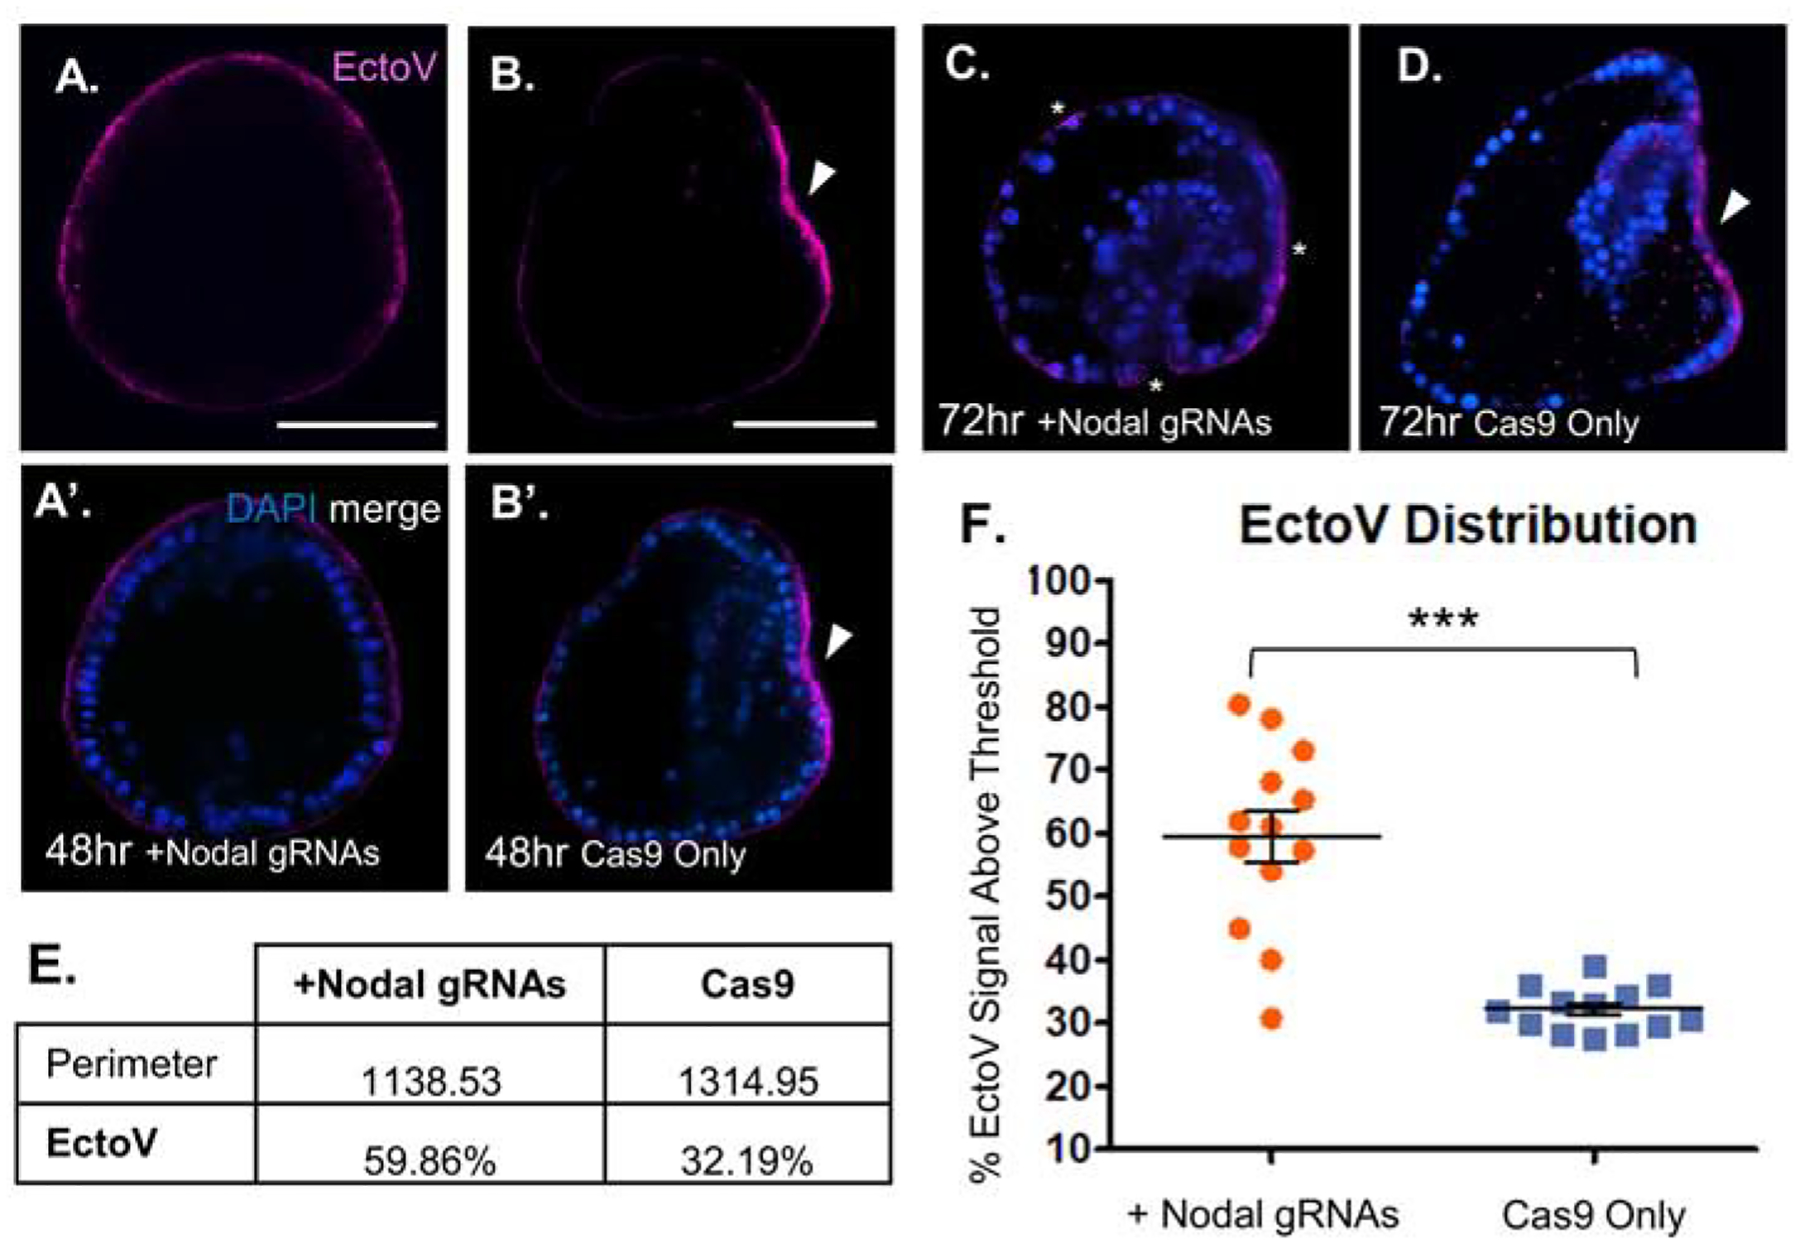
Figure 4. Nodal over-expression promoter mutants show expanded EctoV localization.

A, A’. Overexpression of Nodal from a promoter mutant embryo at 48hpf reveals ubiquitous EctoV surface expression (magenta). Merge with DAPI shown below, Scalebar = 60μm.
B, B’. Cas9 only control embryo viewed laterally shows strongly localized EctoV (magenta) expression on the flattened oral surface (arrowhead). Merge with DAPI shown below, Scalebar = 60μm.
C. Nodal overexpressing promoter mutant embryo at 72hpf viewed laterally showing persistent EctoV expression broadly along all surfaces of the embryo (asterisks). Note defective gut elongation, as well as absence of oral-aboral flattening.
D. Cas9 only control embryo at 72hpf viewed laterally showing tightly restricted EctoV expression on the flattened surface of the oral ectoderm (arrowhead).
E. EctoV localization is not restricted to the oral surface in Nodal promoter mutant embryos. The perimeter of each embryo, representing visible ectodermal surface (relative units), and the percentage of that surface with positive EctoV signal are summarized for the Nodal promoter mutants and Cas9 only control embryos at 48hpf. N=13 each, Nodal mutant and Cas9 only injected embryos were imaged, and compared from the same orientation.
F. Scatterplot of EctoV signal distribution from individual embryos imaged at 48hpf. EctoV expression was quantified as a percentage of magenta signal above threshold (background fluorescence) across the ectodermal surface of the embryo at 48hpf. Nodal promoter mutant (orange) embryos had a significant (p = 3.97E–05) expansion of EctoV signal across the surface ectoderm compared to Cas9 only control (blue) embryos.
