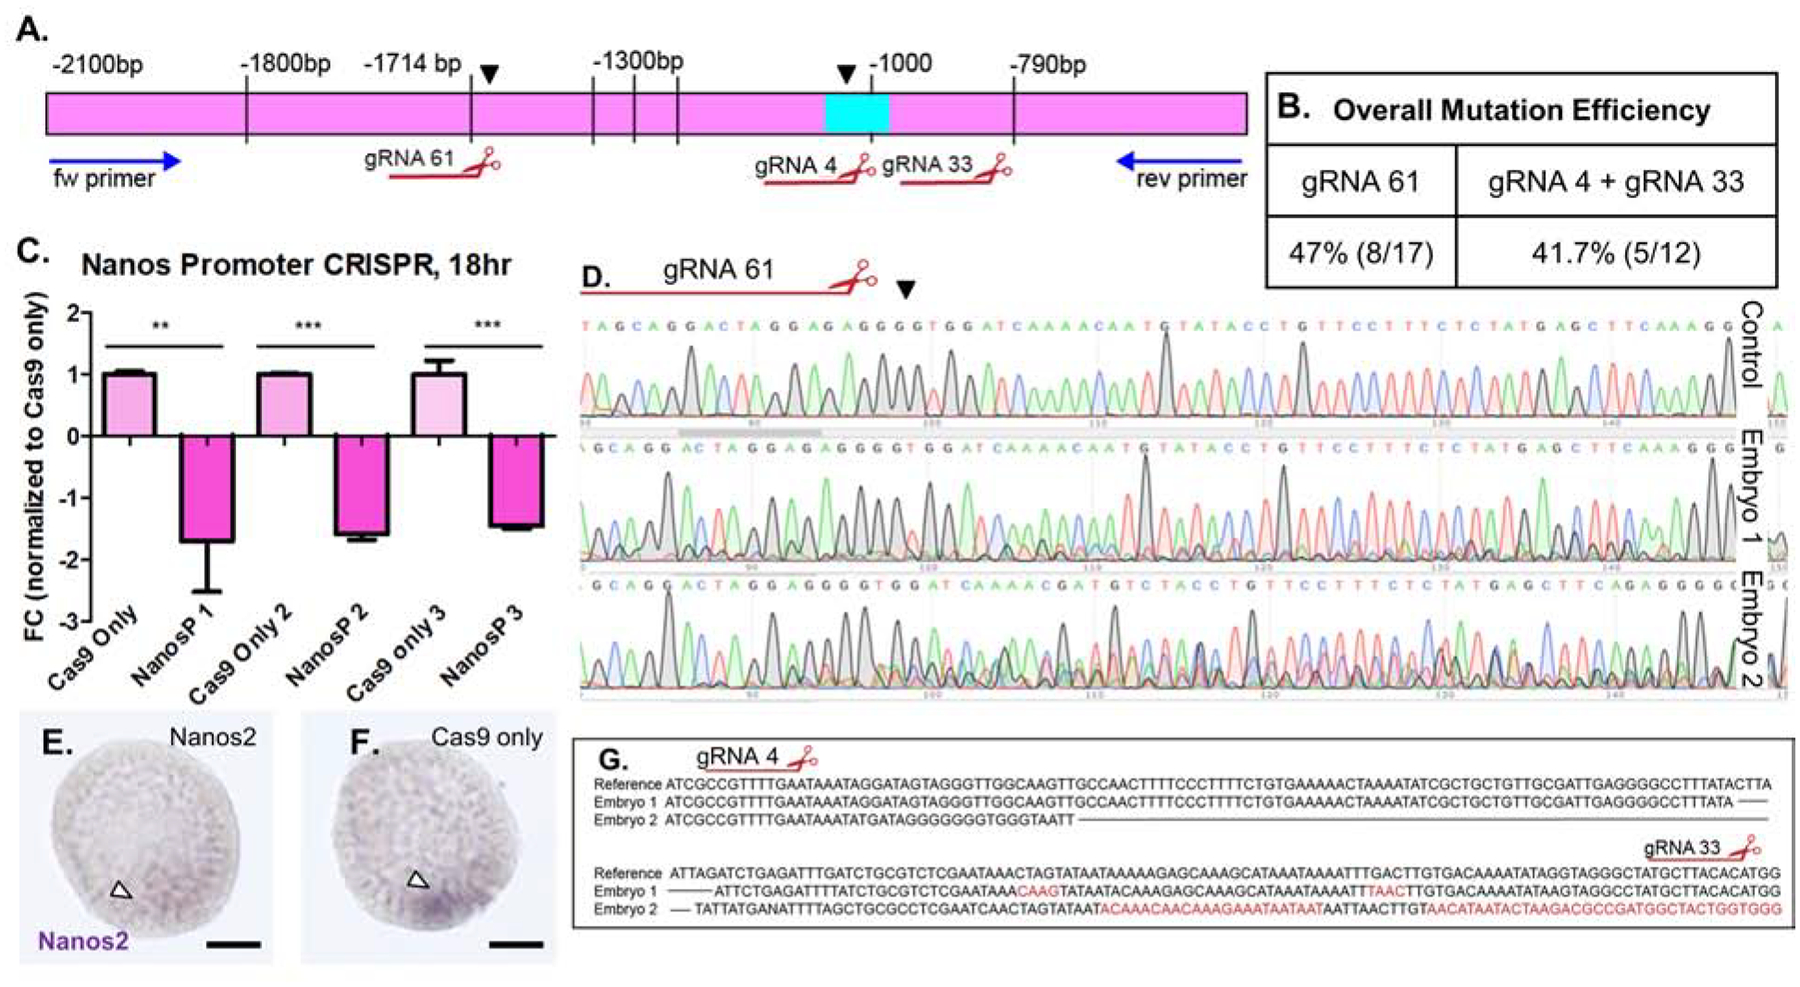
Figure 7. Mutations in the Nanos2 upstream sequences define essential regions for Nanos2 transcription.

Injection of 9 Nanos2 sgRNAs targeting upstream sequences of the Nanos2 gene, along with Cas9 mRNA, generated deletions within a region −1.8kb-800bp upstream of the TSS of Nanos2.
A. Blue arrows represent primers used for sequencing this region and mutations causing transcriptional changes. Black arrowheads denote characterized mutations. Large deletion (aqua box) corresponding to decrease in Nanos2 expression over three independent experiments.
B. Table summarizing overall mutation efficiencies corresponding to the observed decreases in Nanos2 transcription in qPCR data. gRNA 61 produced a mutation identified in 3/5 TIDE sequencing analyses, as well as 5/12 individual embryo genotyping experiments. gRNA 4 and gRNA 33 together mutated a predicted FOXY binding site −1000bp upstream of the TSS observed in 5/12 single embryo genotyping analyses. These mutations are from individual embryos selected at random, not by phenotype.
C. qPCR assay from three independent experiments targeting the Nanos2 upstream region. In each independent experiment, a significant decrease in Nanos2 transcript (1.7–1.9-fold decrease) was observed at the 18hpf blastula stage, when Nanos2 expression is at its highest levels. Single embryo genotyping and sequencing from each of these experiments confirmed mutagenesis within the presumptive promoter region as highlighted by arrowheads in A.
D. TIDE analysis of PCR products from three embryos (two shown) reveals mosaicism following the cut site of gRNA 61, the mosaic pattern of sequencing and peak mismatch continued to decay until −790 bp (see also Supplemental Figure 5).
E. WMISH using Nanos2 dig labelled RNA probe in a representative embryo from the Nanos2 promoter targeted (cas9 + gRNA) injected group. Arrowhead denotes faint Nanos2 signal in Smms. (Scalebar = 20μM).
F. WMISH using Nanos2 dig labelled RNA probe in a representative embryo from the control (Cas9 mRNA only) injected group, note intense purple signal in a small cluster of Smms at the base of blastula (arrowhead).
G. Sanger sequencing from two embryos reveal a large deletion between gRNA 4 and gRNA 33. These embryos represent mutations corresponding to the qPCR (Figure 7C).
