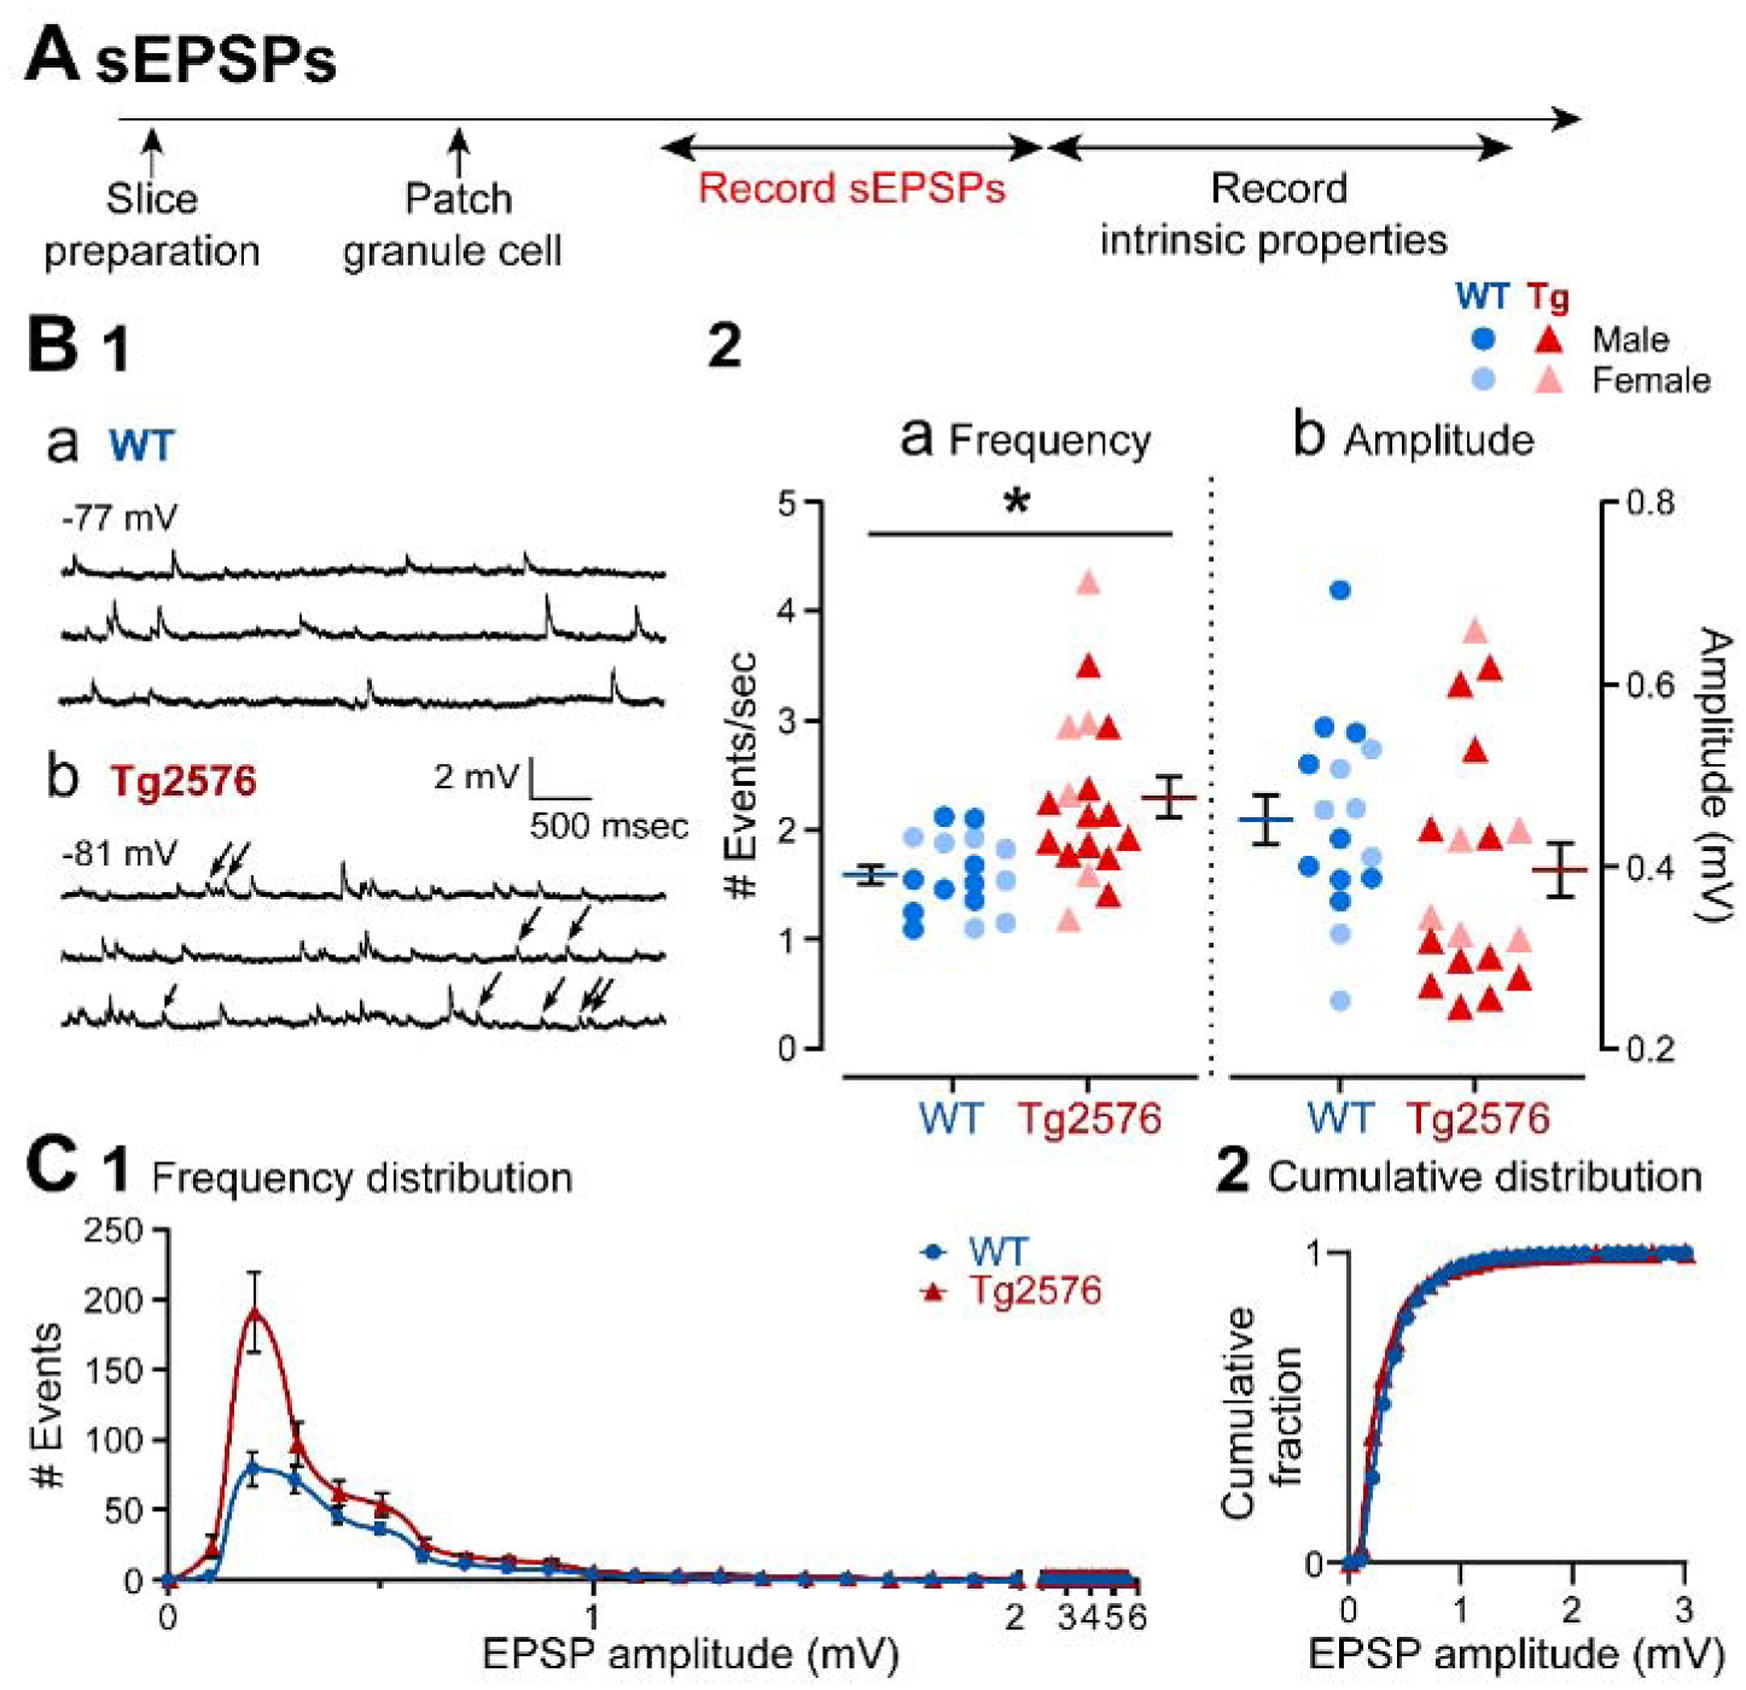
Figure 1. sEPSPs in GCs from Tg2576 mice are increased relative to WT mice.

(A) The timeline of the electrophysiological recordings for the determination of the sEPSPs and intrinsic properties from GCs.
(B1) Representative traces show typical sEPSPs obtained in (a) WT and (b) Tg2576 mice.
(B2) Quantification of sEPSP frequency and amplitude in WT and Tg2576 GCs. SEPSP frequency was significantly greater in Tg2576 mice, but not amplitude.
(C1) A histogram shows the frequency distribution of sEPSP amplitudes.
(C2) The cumulative distribution is shown. Differences between WT and Tg2576 GCs were not significant.
Data are represented as mean ± SEM. *p<0.05. Specific p values and statistics are in the text.
