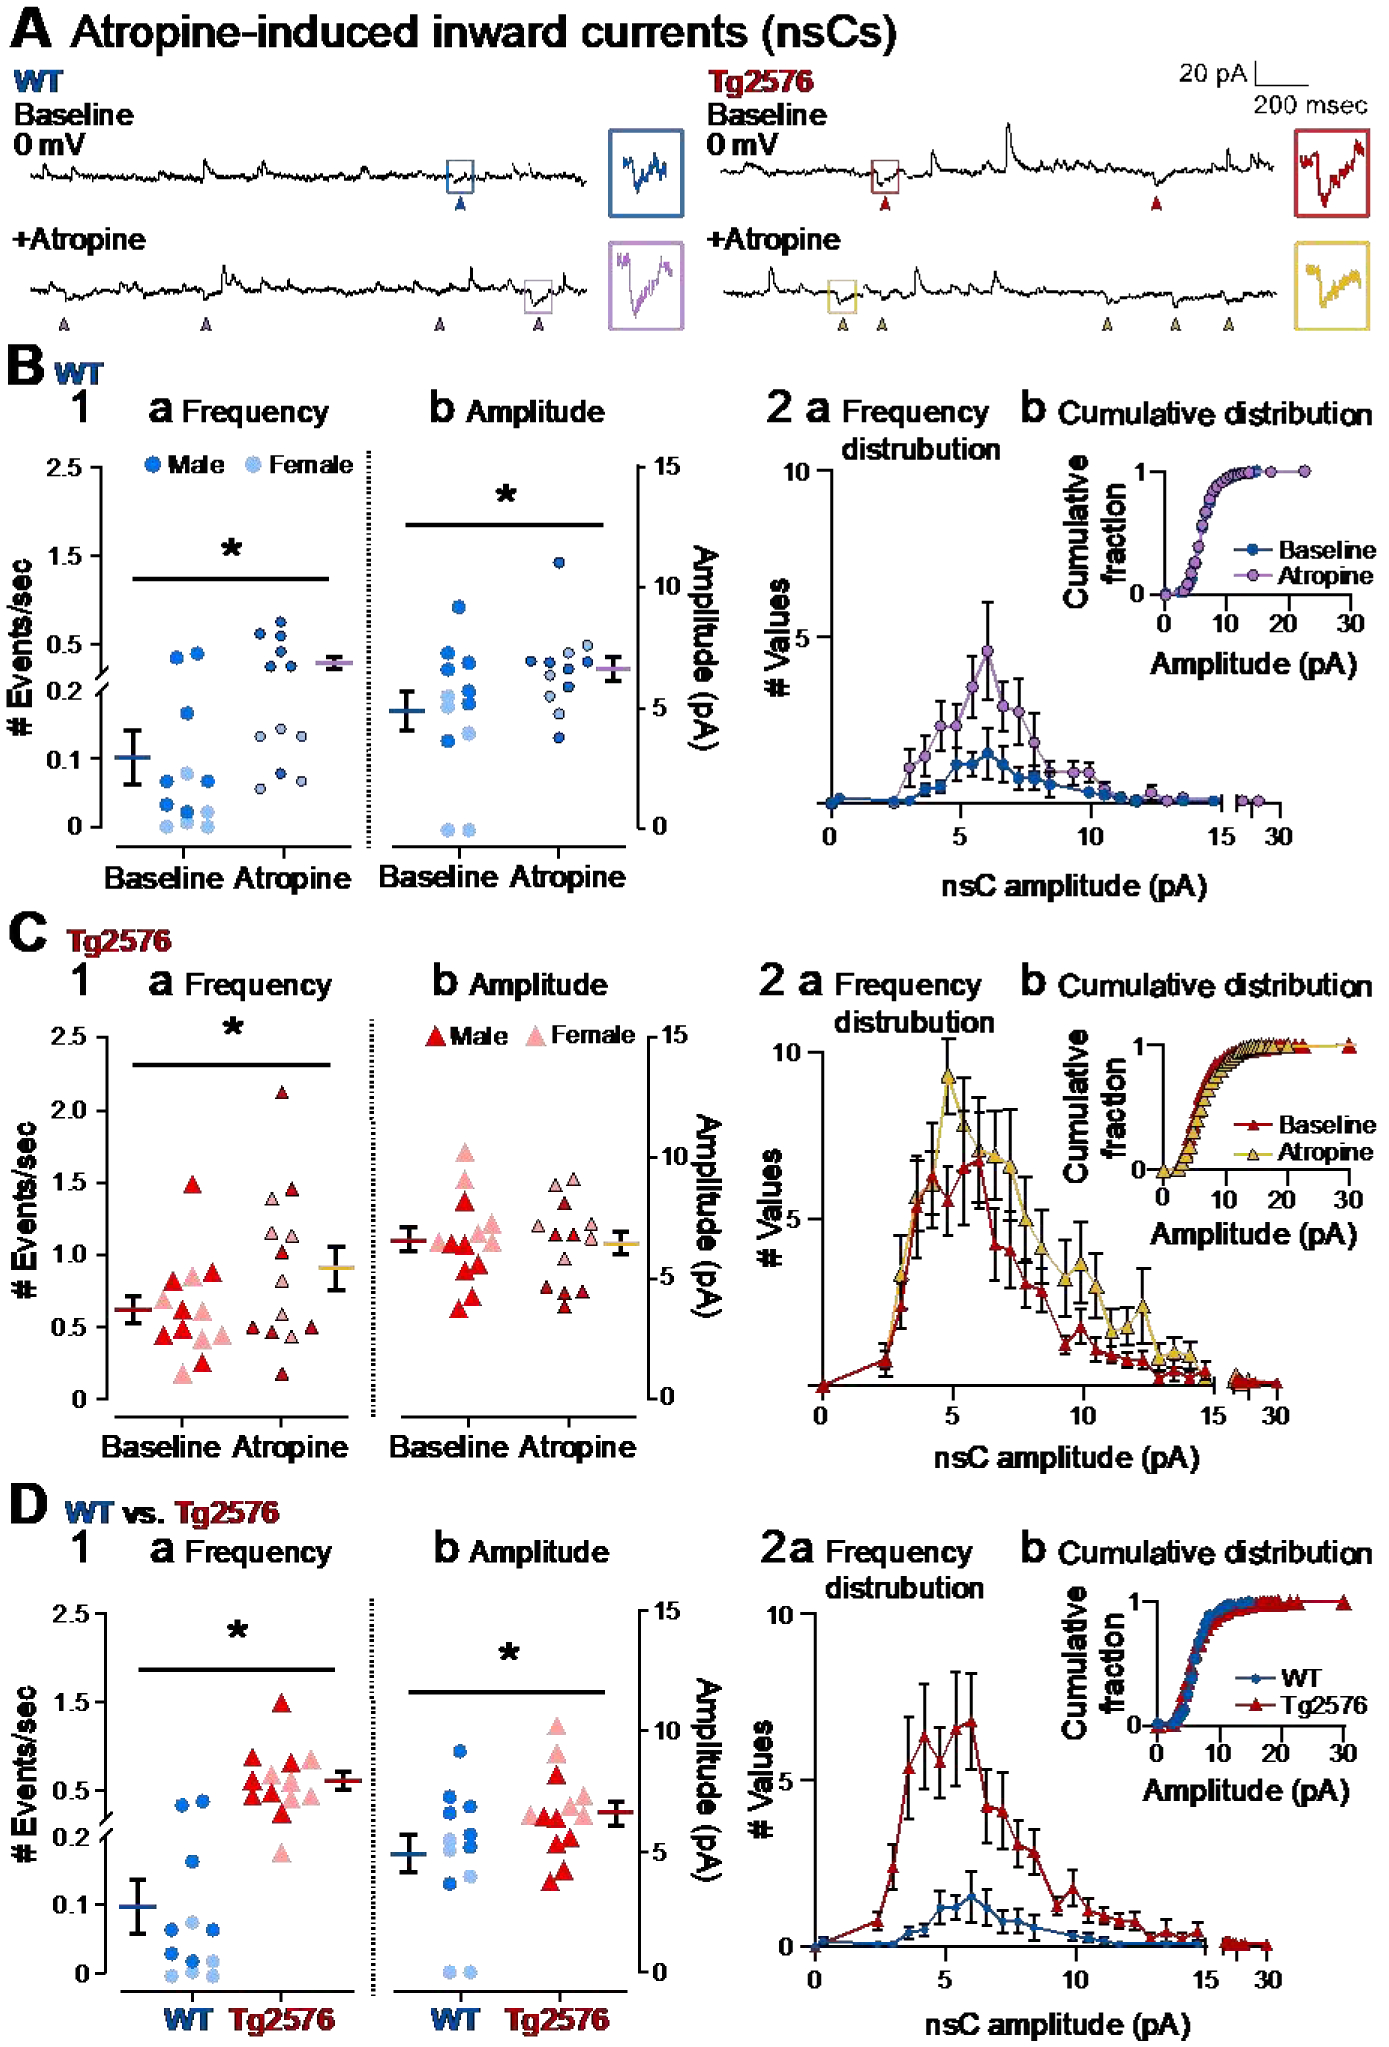
Figure 10. A novel spontaneous inward current (nsC) that is greater in Tg2576 GCs than WT GCs and the effects of atropine.

(A) Representative traces show spontaneous inward currents (pointed with arrows) obtained in WT (left) and Tg2576 mice (right) in baseline conditions and in the presence of atropine (10 μM). Holding potential was 0 mV. The small squares mark examples of the spontaneous inward currents, which we refer to as nsCs. The examples of nsCs are expanded on the right.
(B1) Mean frequency (a) and amplitude (b) of nsCs are shown for WT mice during the baseline and after atropine was added. Atropine significantly increased the frequency and amplitude of nsCs.
(B2) WT nsC frequency distributions (a) and cumulative distributions (b) are shown. Atropine did not cause significant changes to the cumulative distributions relative to baseline conditions.
(C1) Mean frequency (a) and amplitude (b) of nsCs are shown for Tg2576 mice. Atropine significantly increased the frequency of nsCs but not the amplitude.
(C2) Tg2576 nsC frequency distributions (a) and cumulative distributions (b) are shown. Atropine did not cause significant changes to the cumulative distributions, like WT mice.
(D1) Comparisons of WT and Tg2576 GCs for nsC frequency (a) and amplitude (b) during baseline conditions. Tg2576 GCs had significantly more frequent and larger nsCs than WT mice.
(D2) NsC frequency distributions (a) and cumulative distributions (b) for WT and Tg2576 GCs during baseline conditions are shown. The cumulative distribution of nsCs did not show a significant difference.
