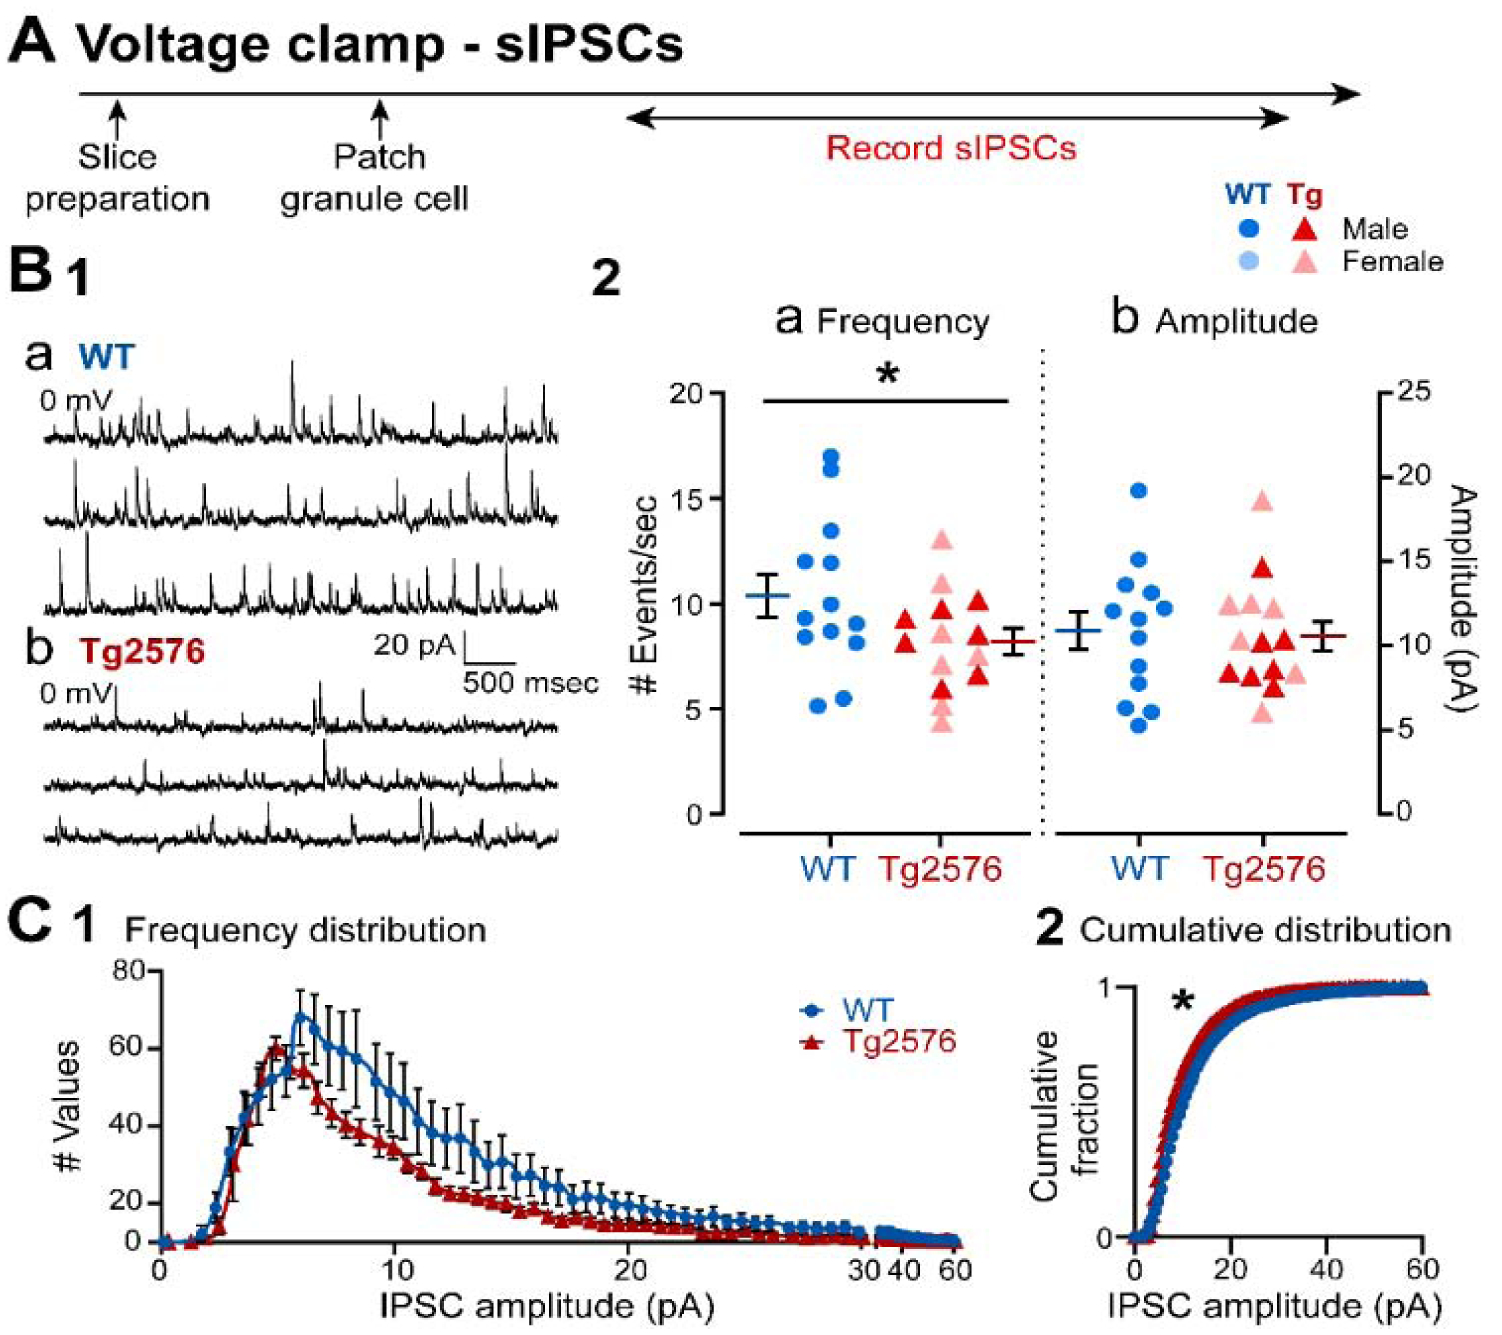
Figure 3. sIPSCs are decreased in GCs from Tg2576 mice relative to WT mice.

(A) The timeline of the electrophysiological recordings for the determination of the sIPSCs from GCs.
(B1) Representative traces show typical sIPSCs obtained in (a) WT and (b) Tg2576 mice at 0 mV holding potential.
(B2) Quantification of sIPSC frequency and amplitude in WT and Tg2576 GCs. Tg2576 GCs had a significantly reduced sIPSC frequency, but not in amplitude compared to WT GCs.
(C1) A histogram shows the frequency distribution of sIPSC amplitudes.
(C2) The cumulative distributions for WT and Tg2576 GCs were significantly different.
