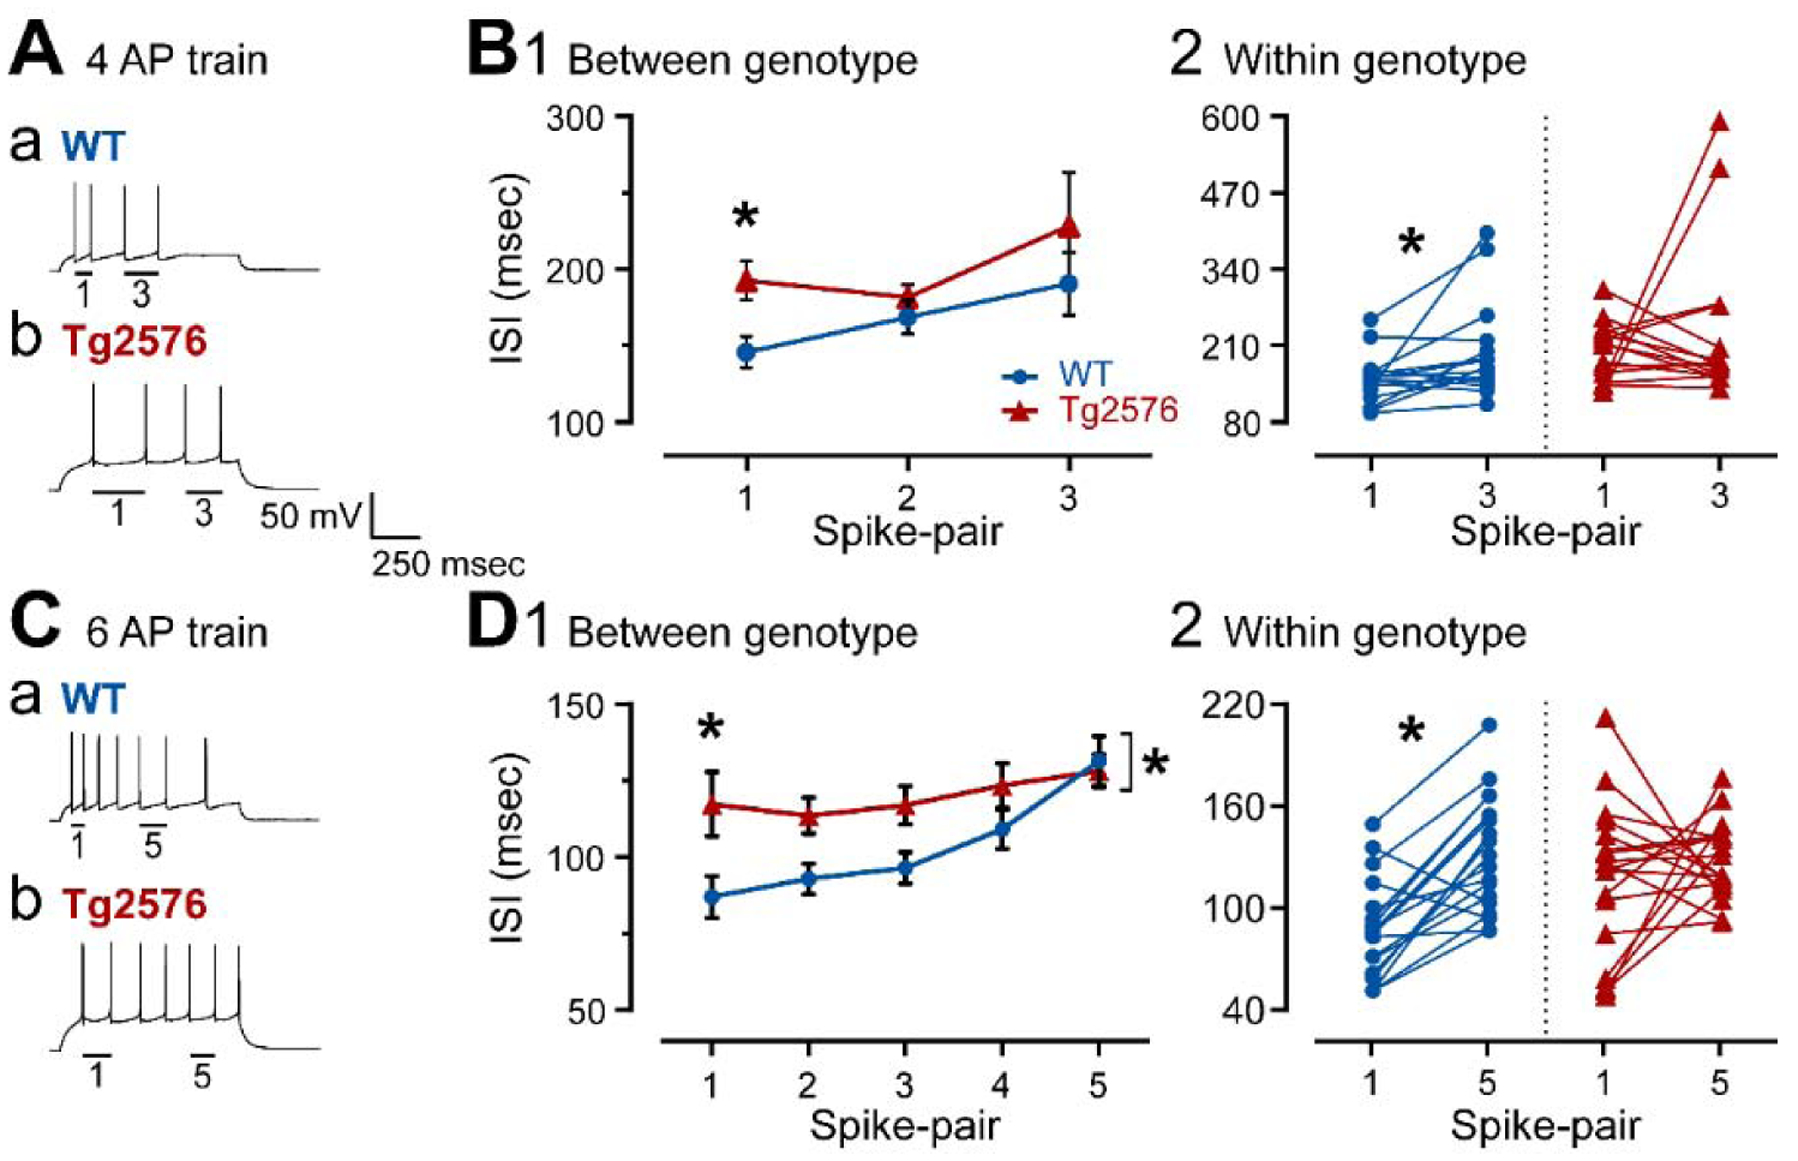
Figure 6. Spike frequency adaptation is reduced in GCs from Tg2576 mice compared to WT.

(A) Representative traces of 4 AP trains induced by positive current steps to GCs from (a) WT and (b) Tg2576 mice. The first (1) and the third (3) AP pairs are labeled by the bars below them.
(B1) Spike frequency adaptation was quantified in WT and Tg2576 mice by measuring the ISI for each AP pair and plotting them sequentially. The first ISI was significantly longer ISI in Tg2576 mice.
(B2) Comparisons of the first and third AP pairs showed that the first ISI was significantly shorter in WT mice, indicating adaptation occurred, but not in Tg2576 mice, suggesting Tg2576 mice have weak adaptation.
(C) Representative traces of 7 AP trains induced by positive current steps to GCs from (a) WT and (b) Tg2576 mice. The first (1) and 5th (5) AP pairs are labeled by the bars below the traces.
(D1) Spike frequency adaptation was quantified in WT and Tg2576 mice by measuring the ISI for each AP pair and plotting them sequentially. The first ISI was significantly longer in Tg2576 mice. The sequence of ISIs were also significantly different, with Tg2576 mice exhibiting longer ISIs.
(D2) Comparisons of the first and fifth AP pairs showed that the first ISI was significantly shorter in WT mice, indicating adaptation occurred, but not Tg2576 mice, suggesting Tg2576 mice have weak adaptation.
