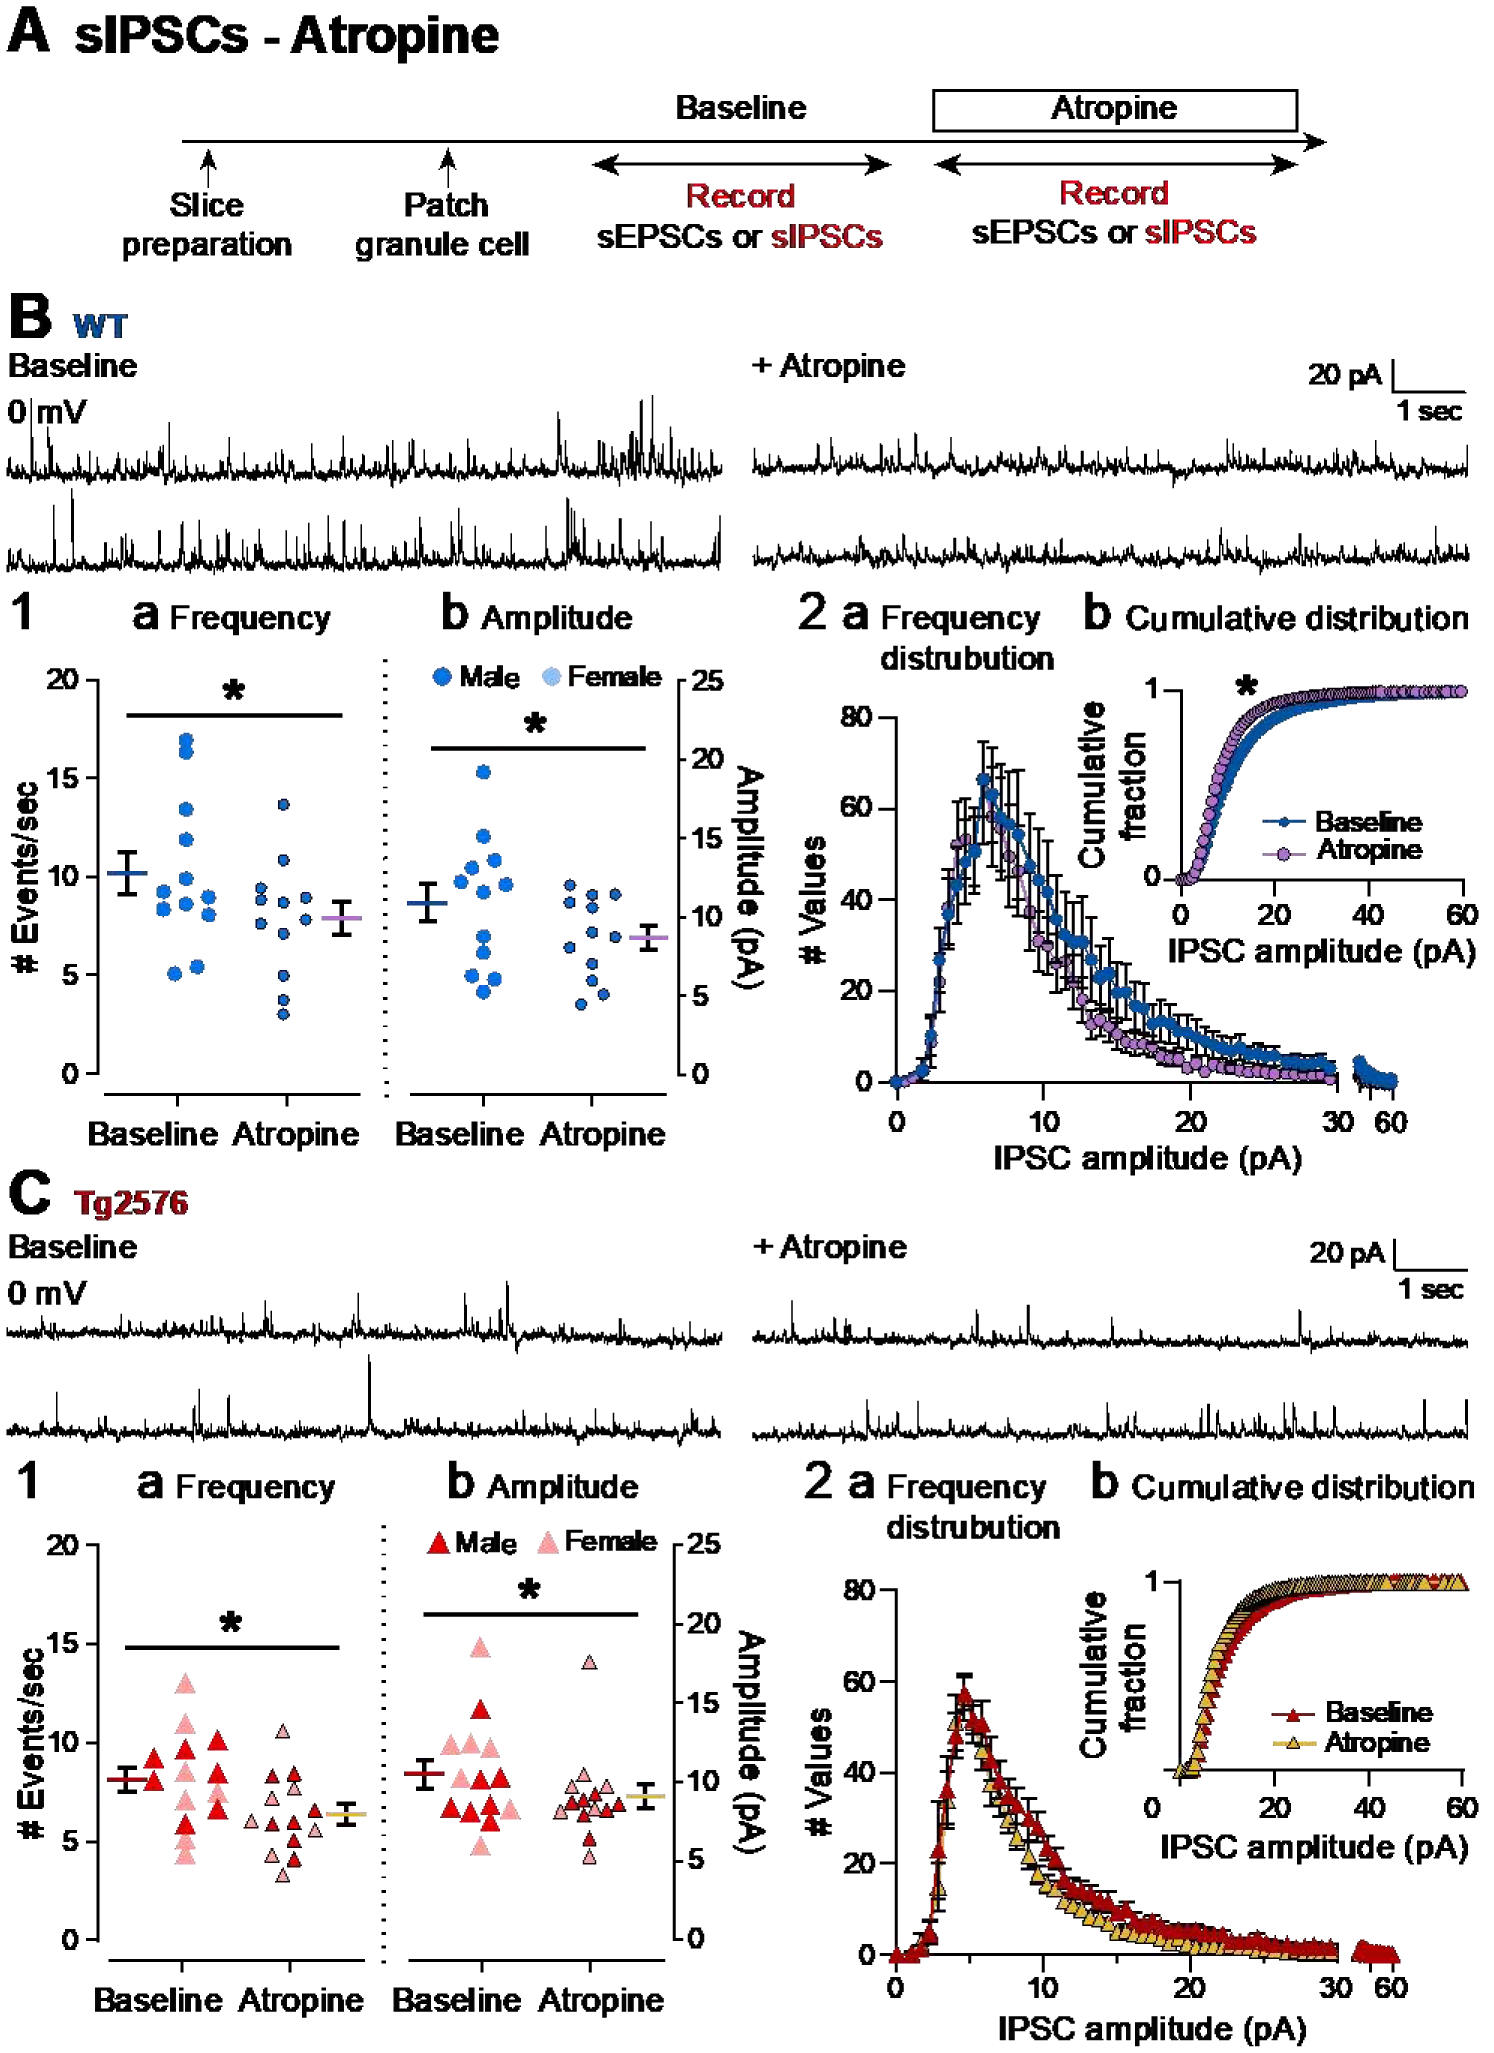
Figure 9. Atropine reduces sIPSC frequency and amplitude in both WT and Tg2576 mice.

(A) The timeline of electrophysiological recordings used to determine effects of atropine on sIPSCs of GCs from WT and Tg2576 mice.
(B) Representative traces of sIPSCs for WT GCs obtained in baseline conditions (left) and in presence of atropine (right).
(B1) Quantification of the (a) frequency and (b) amplitude of sIPSCs for WT GCs show that atropine reduced frequency and amplitude in WT mice.
(B2) Histograms showing the (a) frequency distribution of sIPSPs amplitudes for WT GCs. Insets (b) show the cumulative distributions where there is a significant effect of atropine in WT mice.
(C) Representative traces of sIPSCs for Tg2576 GCs obtained in baseline conditions (left) and in presence of atropine (right).
(C1) Quantification of the (a) frequency and (b) amplitude of sIPSCs for Tg2576 GCs show that atropine reduced frequency and amplitude in Tg2576 mice.
(C2) Histograms showing the (a) frequency distribution of sIPSPs amplitudes for Tg2576 GCs. Insets (b) show the cumulative distributions. There was not a significant effect of atropine in Tg2576 mice.
