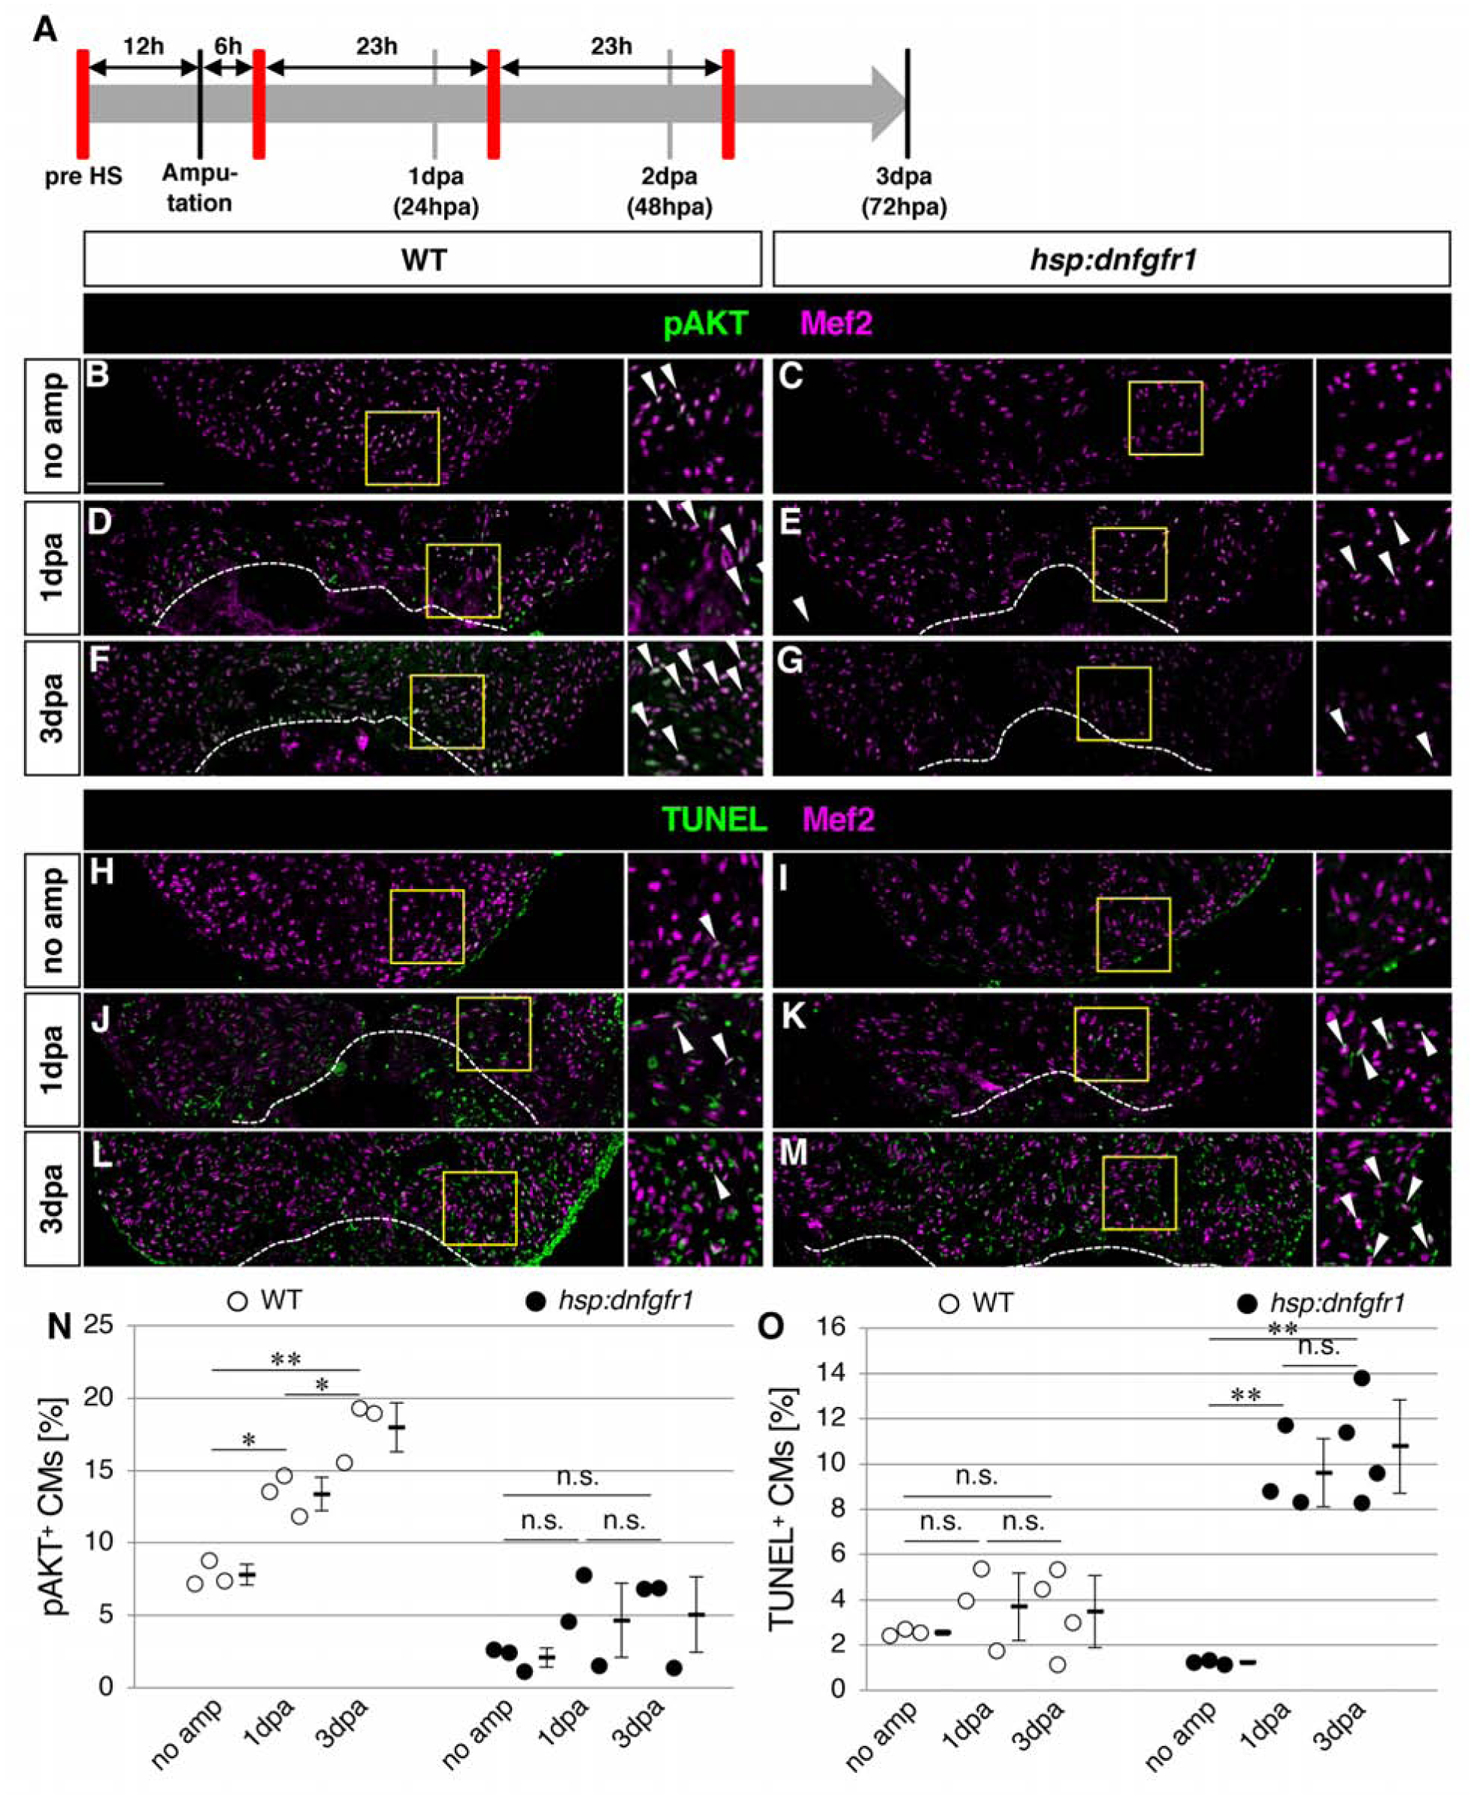
Figure 4. FGF signaling is required for activation of AKT signaling and cardiomyocyte survival.

(A) Schematic presentation of experimental design. The red bars represent dnfgfr1 induction by pulses of heat shock.
(B-G) Confocal images of the pAKT and Mef2 signals in the ventricle without amputation (B, C) and after amputation (D-G) in WT (B, D, F) and hsp: dnfgfr1 fish (C, E, G).
(H-M) Confocal images of the Mef2 and TUNEL signals in the ventricle without amputation (H, I) and after amputation (J-M) in WT (H, J, L) and hsp: dnfgfr1 fish (I, K, M).
(N) Graphic presentation of the percentage of the pAKT-positive CMs among CMs in the apex at indicated time points.
(O) Graphic presentation of the percentage of the TUNEL-positive CMs among CMs in the apex at indicated time points.
Dotted lines in D-G and J-M indicate amputation planes. The areas in yellow squares in B-M are shown on the right side. Arrowheads point to double positive cells. Scale bar, 100 μm. * p<0.05, ** p<0.01 by one-way ANOVA with Tukey HSD. n.s., not significant (p≥0.05). n=3 for no amputation, 1 dpa and 3 dpa in both WT and hsp: dnfgfr1 fish in N and O. Each circle in graphs represents an average value for each animal.
