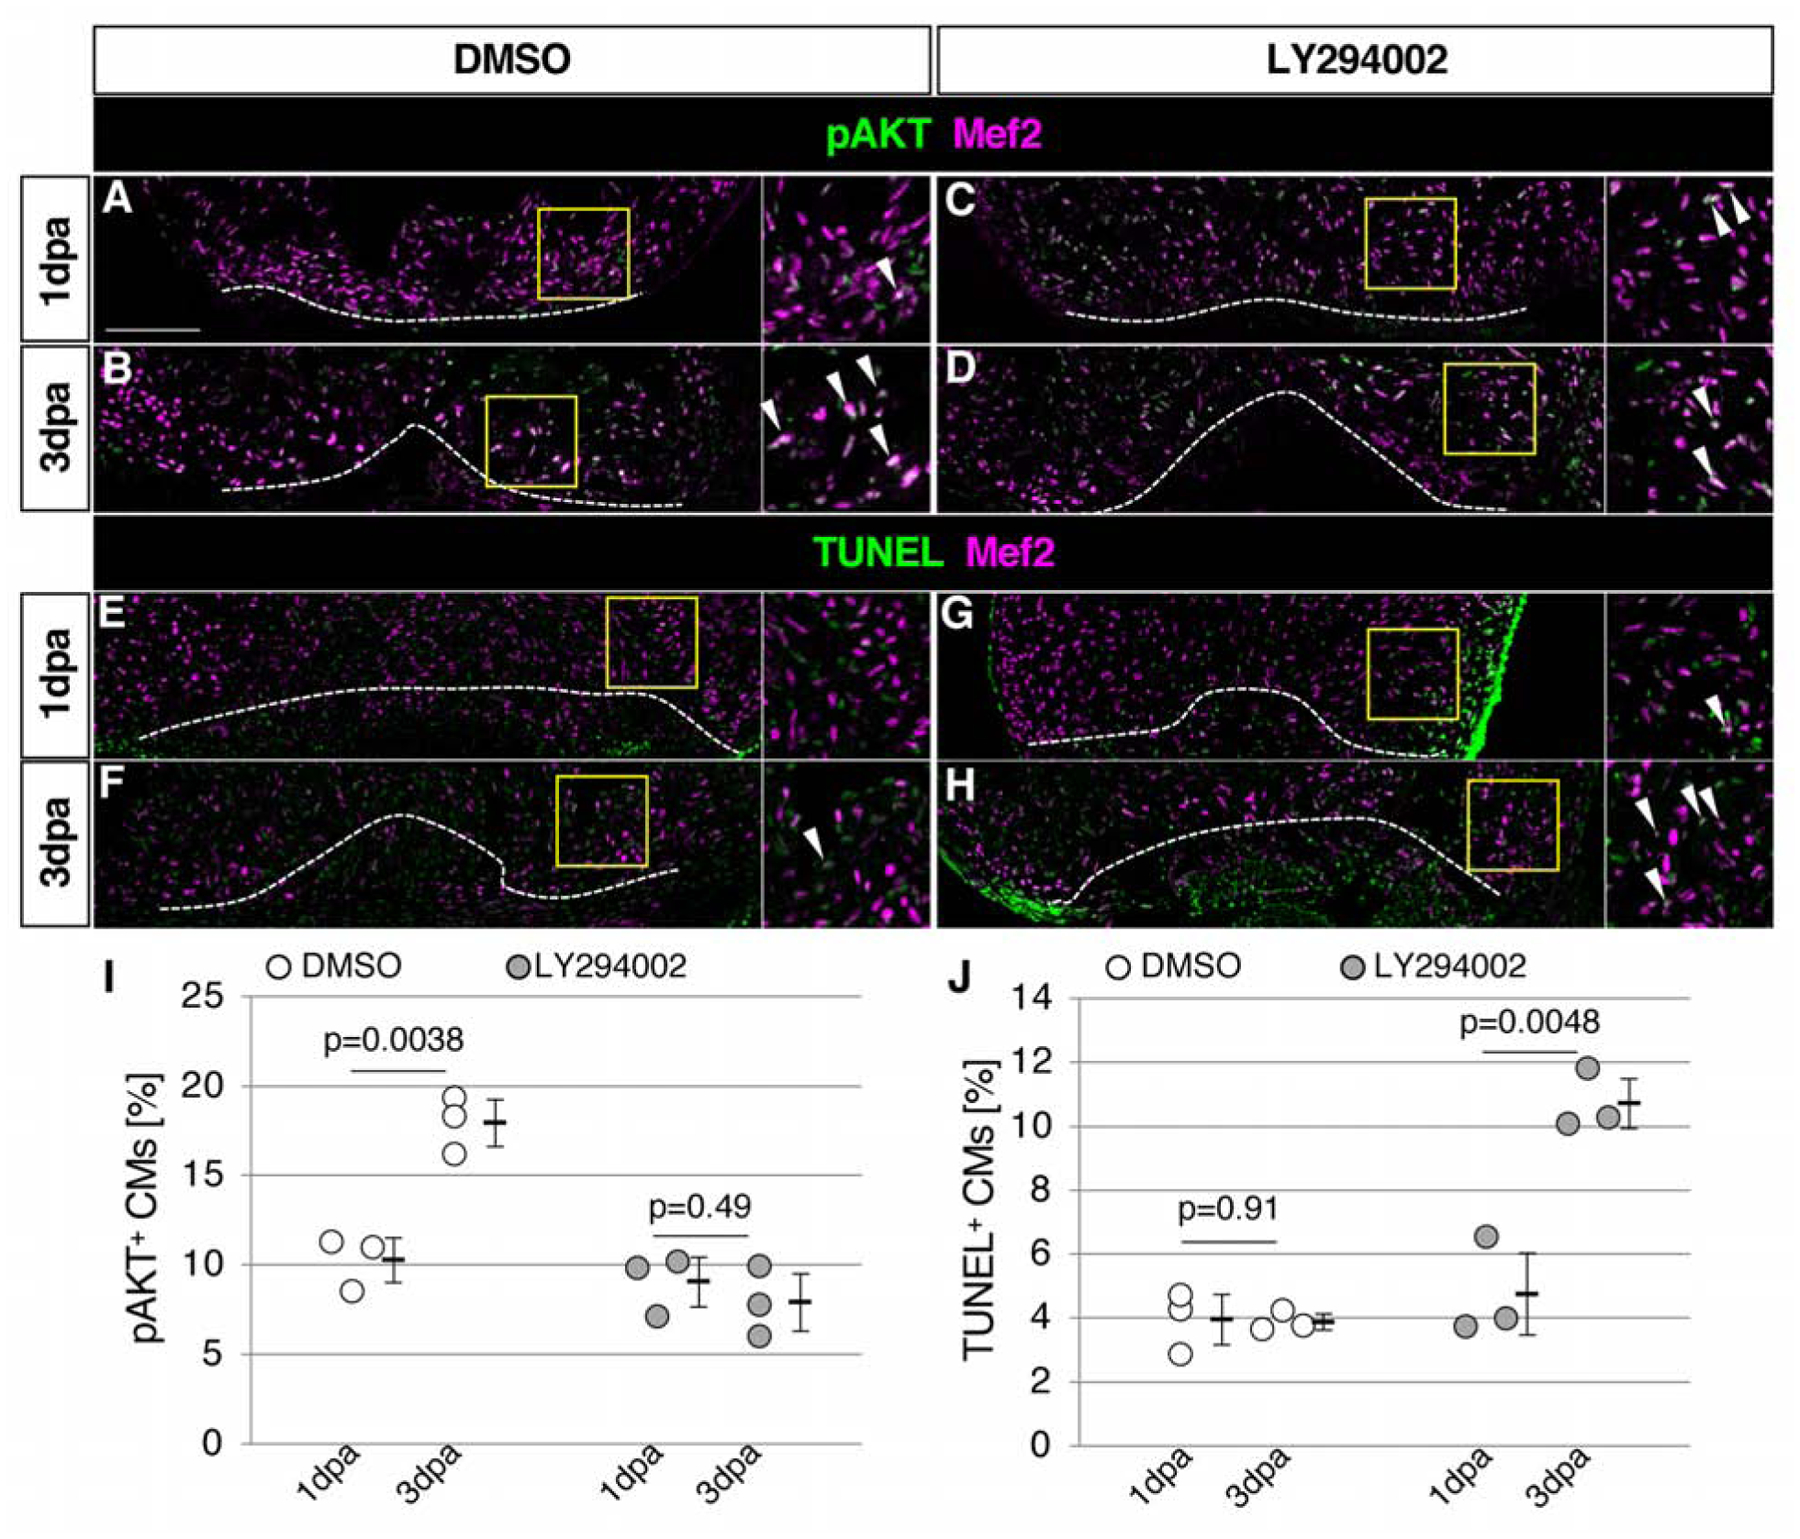
Figure 5. Cardiomyocyte survival depends on AKT signaling.

(A-D) Confocal images of the pAKT and Mef2 signals in the ventricle at 1dpa (A, C) and 3dpa (B, D) in DMSO-treated control fish (A, B) and LY294002-treated fish (C, D).
(E-H) Confocal images of the Mef2 and TUNEL signals in the ventricle at 1dpa (E, G) and 3dpa (F, H) in DMSO-treated control fish (E, F) and LY294002-treated fish (G, H).
(I) Graphic presentation of the percentage of the pAKT-positive CMs among CMs in the apex at indicated time points. n=3 for all samples.
(J) Graphic presentation of the percentage of the TUNEL-positive CMs among CMs in the apex at indicated time points.
Dotted lines in A-H indicate amputation planes. The areas in yellow squares in A-H are shown on the right side. Arrowheads point to double positive cells. Scale bar, 100 μm. p values by Student’s t-test are shown in the graph. n=3 for 1 dpa and 3 dpa in both DMSO-treated and LY294002-treated fish in I and J. Each circle in graphs represents an average value for each animal.
