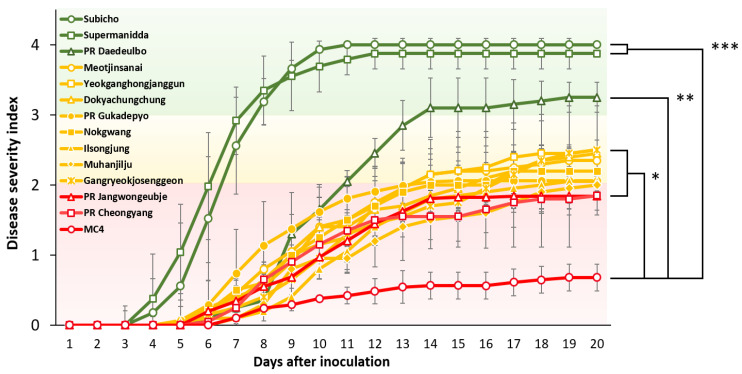
Figure 5.
Disease progression through leaf to whole plant spread bioassay (LWB) in 12 pepper accessions. The eight-leaf stage seedlings were inoculated with R. solanacearum SL1931 with bacterial suspensions 1 × 10 6 CFU/mL to give inoculum volume of 0.1 mL/leaf. A line graph area of red, yellow, and green indicated resistance (R), moderate resistance (MR), susceptible (S), and the color of line was expressed the same as the areas based on the DSI score of the bacterial wilt on 20 dai for each cultivar. Each data point represents the mean disease index from at least two independent experiments. Each bar represents the S.E from three independent experiment with 24 plants. Asterisks indicate statistically significant differences (* p < 0.05, ** p < 0.01, *** p < 0.001) in AUDPC (0 to 15d), according to Student’s t-test with ‘MC4′.

