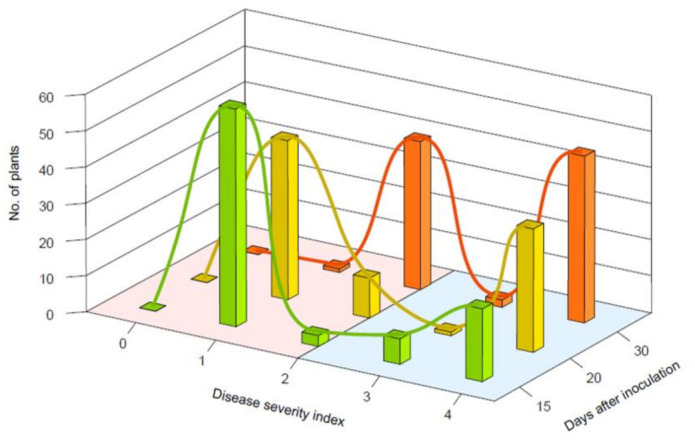
Figure 6.

Histograms and curve graphs represented the number of plants’ phenotype segregation based on disease severity scores of the F2 population (n = 90) at 15 (green bar), 20 (yellow bar), and 30 dai (orange bar). The plants were inoculated with R. solanacearum strain SL1931, the bacterial suspensions are 1 × 10 6 CFU/mL to give inoculum volume of 0.1 mL/leaf at fully expended 3rd and 4th leaf stages in a plant. The red zone and blue zone represent resistance and susceptible, respectively.
