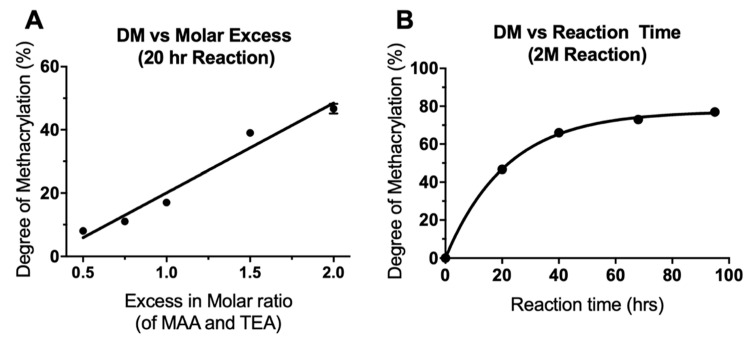
Figure 2.
Alteration of the degree of methacrylation by (A) varying the molar ratio of reactants (linear regression curve fitted, R2 = 0.96) and (B) varying the reaction time (one phase decay curve fitted, R2 = 0.99). N = 1, n = 1, except for 2M20 where N = 3, n = 1 so mean ± SD shown only for 2M20 (error bars are too small to be observed in B).

