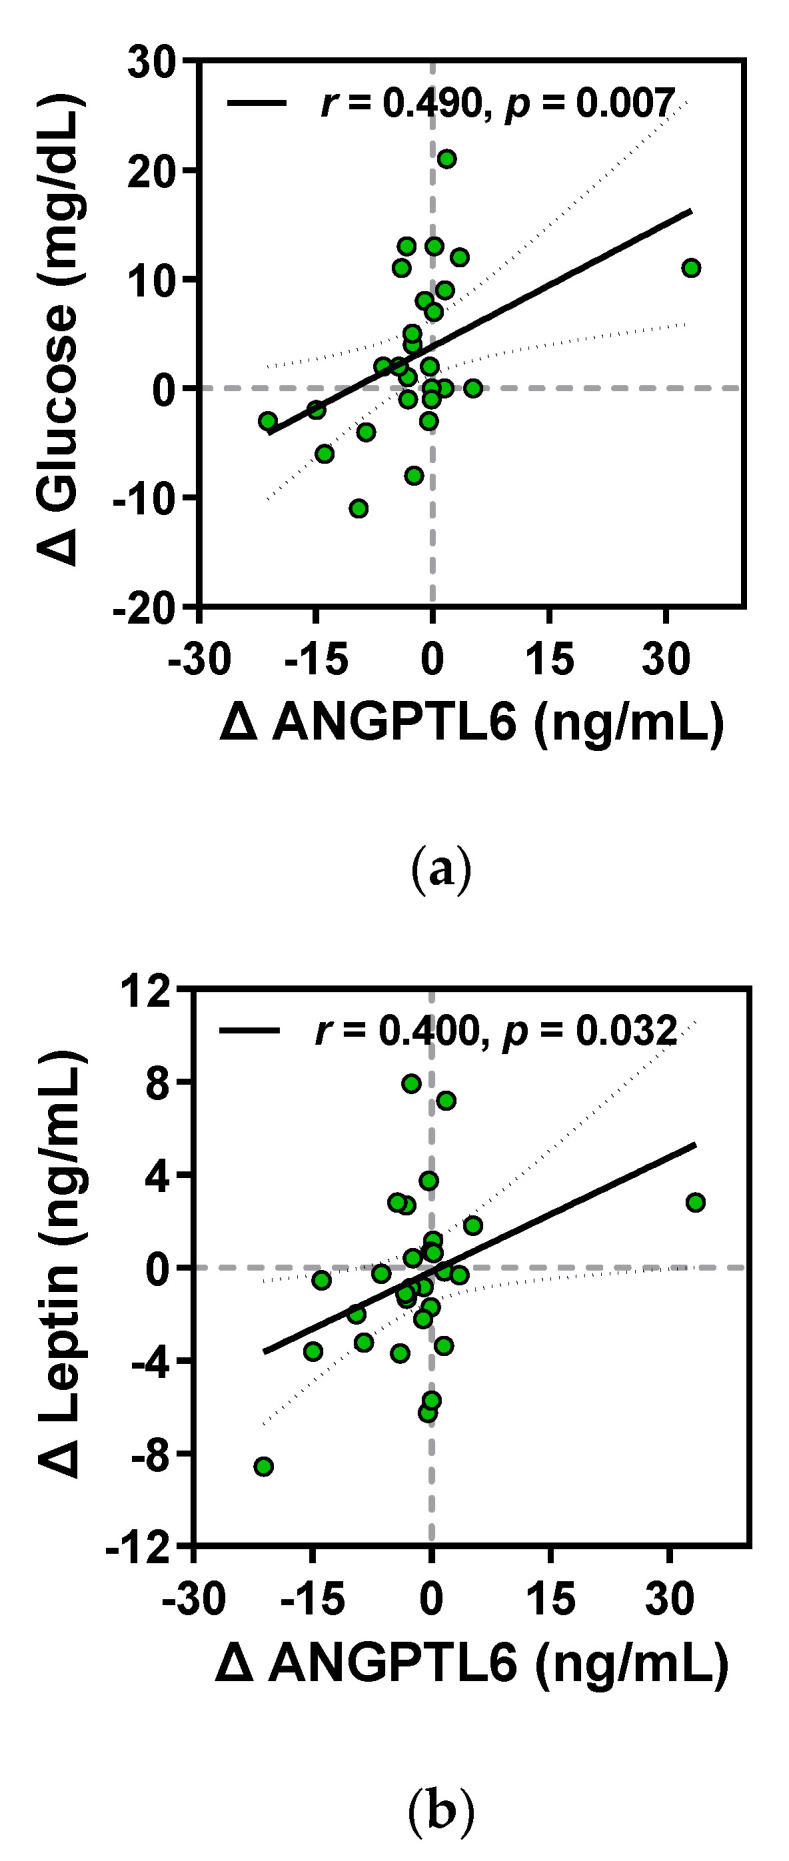
Figure 5.

Correlations of Δ ANGPTL6 level with (a) Δ glucose and (b) Δ leptin levels before and after the intervention. Correlation coefficient (r), corresponding regression and 95% CI lines, and p-values are represented in the respective panels. Green-filled circles are individual values.
