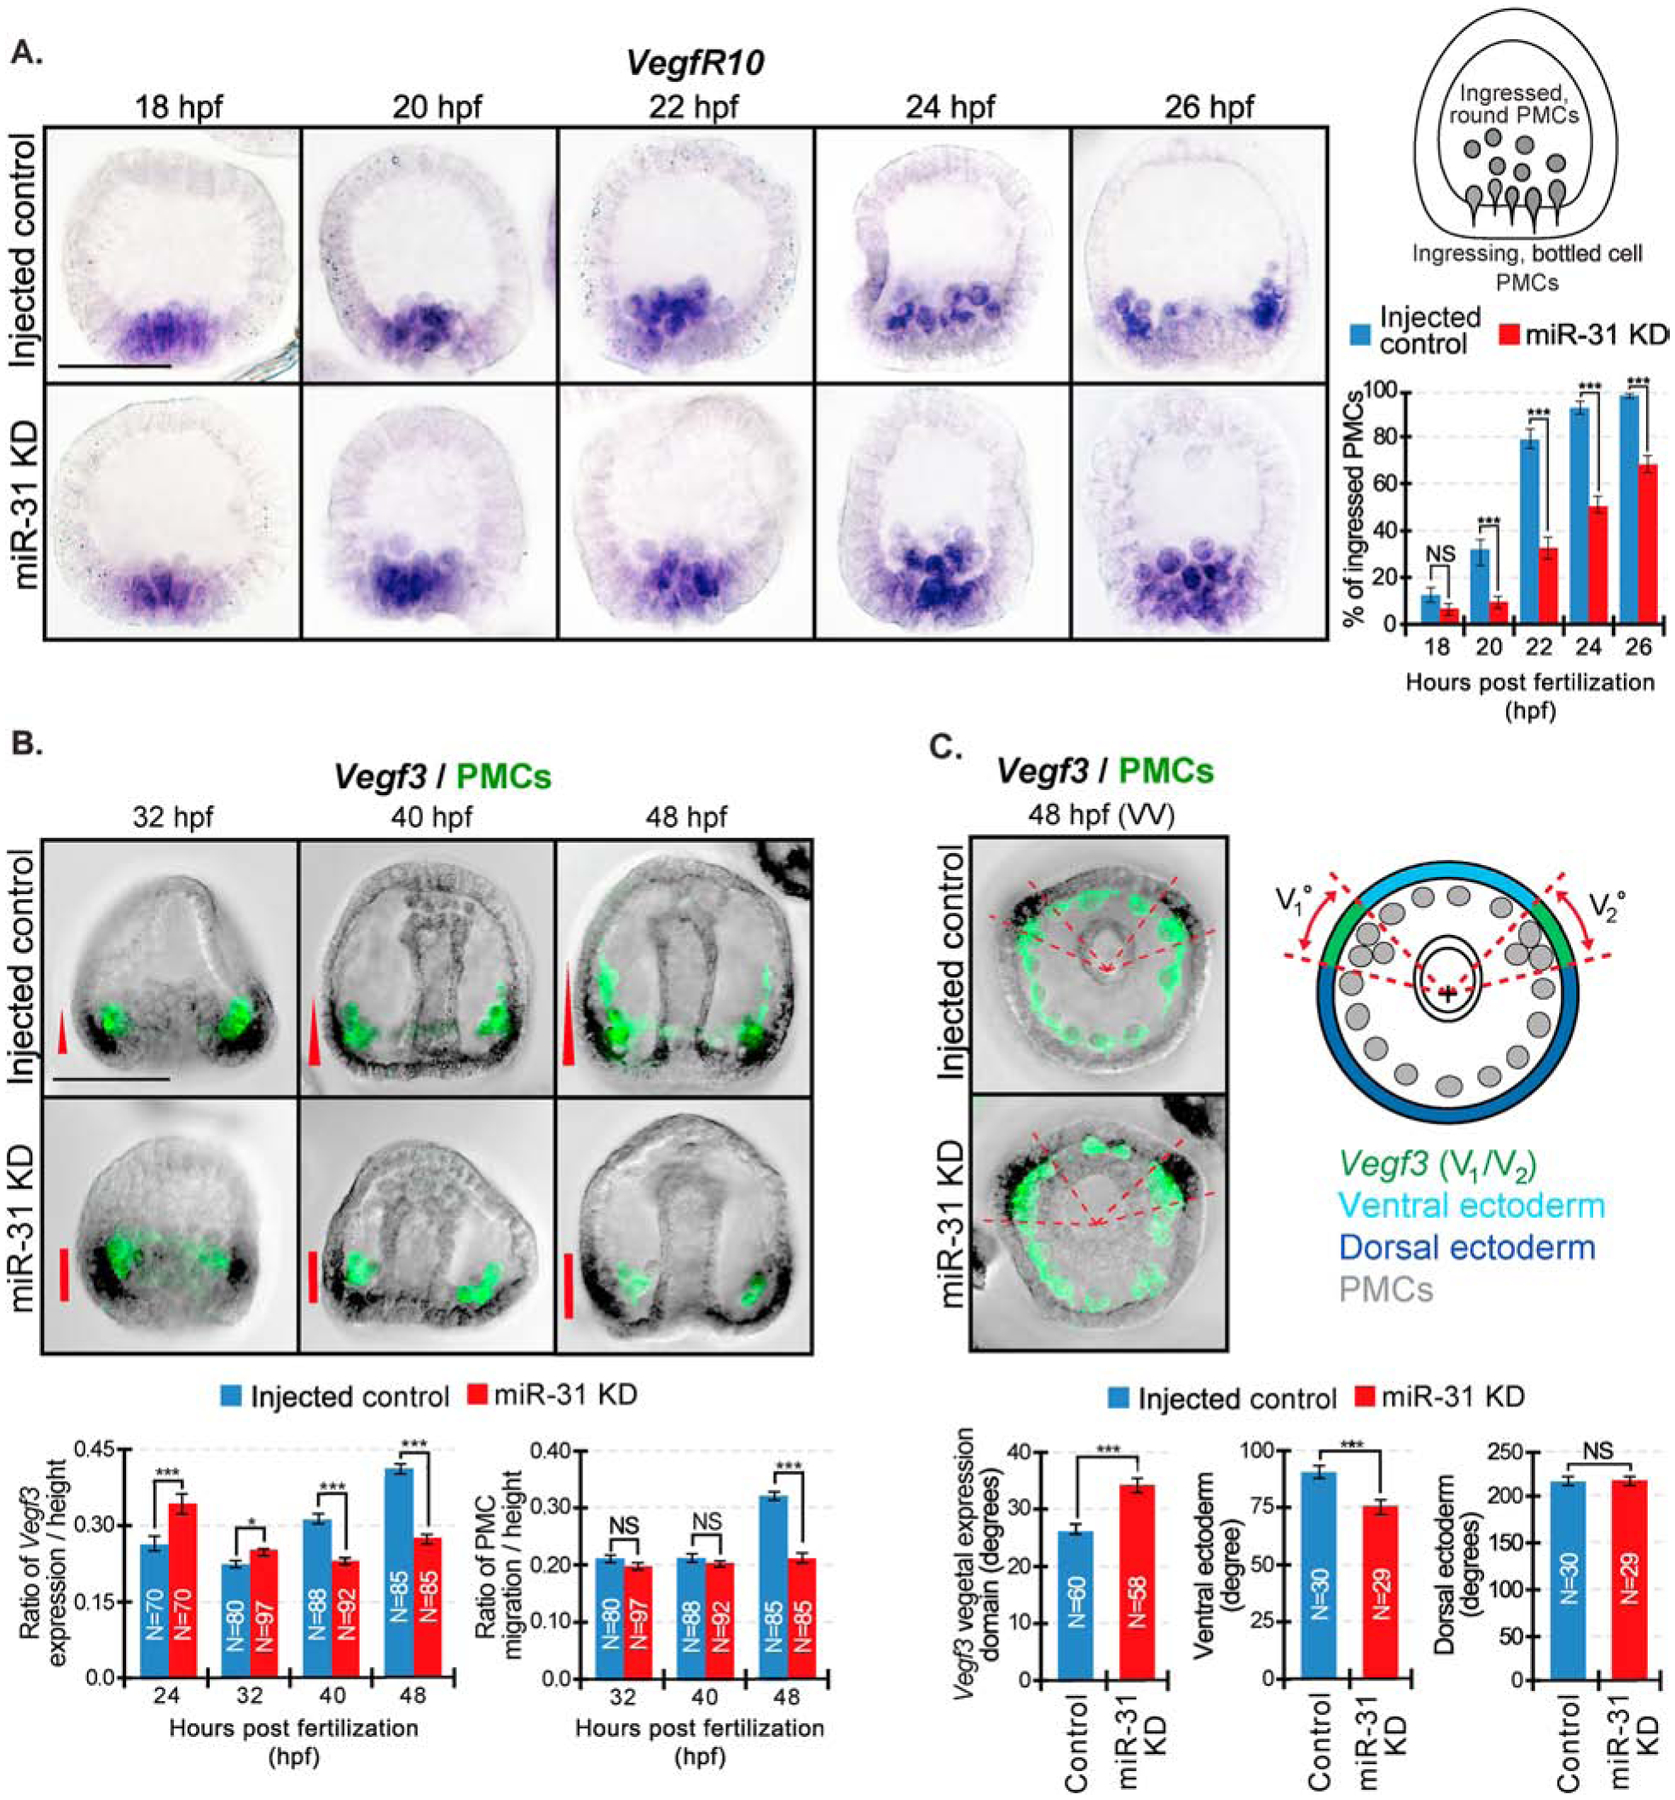
Figure 9. miR-31 KD embryos exhibit a delay in PMC ingression and express ectopic Vegf3 expression domain that correlates with PMC patterning defects.

WMISH was performed on embryos to visualize Vegf3 or VegfR10 followed by PMC immunolabeling with the 1D5 antibody. (A) Control and miR-31 KD embryos were collected at various time points spanning PMC ingression. VegfR10-expressing PMCs were categorized as either “ingressed, round” PMCs or “ingressing, bottle cell” PMCs. VegfR10-positive PMCs were counted through a series of Z-stack images. The percentage of “ingressed, round” PMCs from each embryo were calculated from the total of VegfR10-expressing PMCs. Average percentage was taken from each time point. For all conditions, a total of 30 embryos were measured for 3 biological replicates. NS=not significant, ***p<0.0001 using Cochran-Mantel-Haenszel test. All error bars represent SEM. 3 biological replicates. Scale bar = 50μm. (B) Embryos undergoing gastrulation were collected between 32 to 48 hpf. Embryos were first hybridized with Vegf3 RNA probe and followed with immunolabeling against 1D5 antibody that recognizes the PMCs (McClay et al., 1983). In control gastrulae, PMCs have migrated anteriorly in parallel to the Vegf3 gradient at 48hpf. In miR-31 KD gastrulae at 48 hpf, PMCs are clustered next to the concentrated Vegf3 expression domain. The general trend of Vegf3 expression domain correlates with the anterior distance of PMC migration. (C) Vegf3 expression is indicated in red. Zen software was used to determine the center of gastrulae in the vegetal view and to determine angles of Vegf3 expression, VE, and DE domains. In the vegetal view (VV), the measured angle of Vegf3 (V1/V2) expression domain in miR-31 KD is expanded into the VE compared to control. N is the total number of Vegf3 expression domains measured. 3 biological replicates. NS=not significant. *p<0.05, ***p<0.0001 using Student’s t-test. All error bars represent SEM. Scale bar = 50μm. Representative images were taken with ZEISS Observer Z1 microscope.
