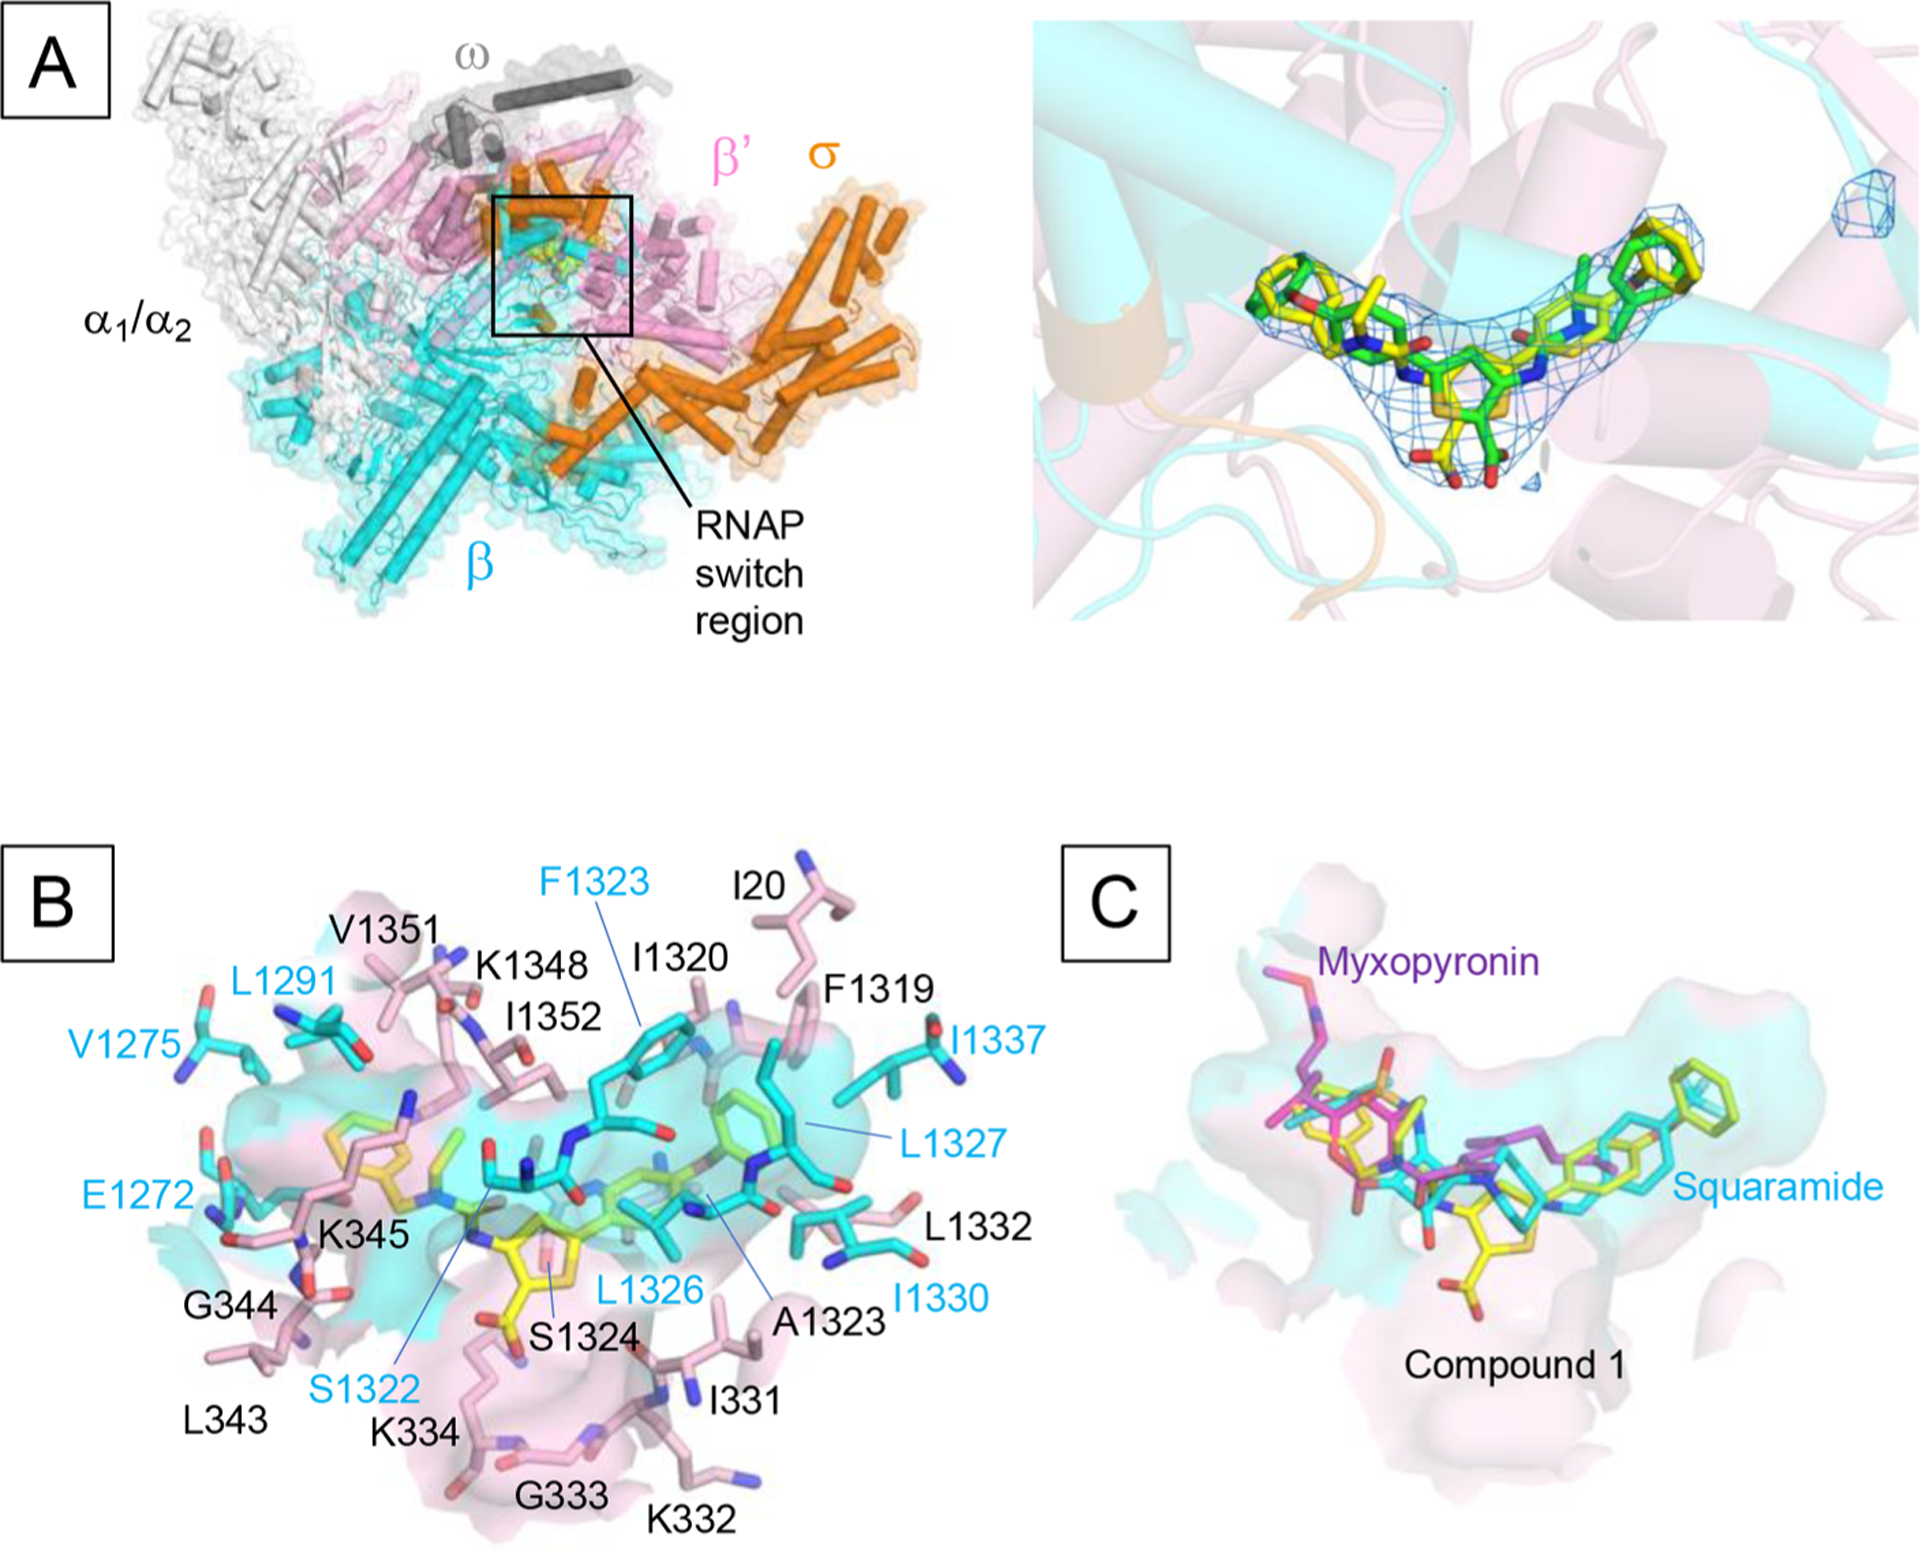
Figure 3.

The structure of RNAP–ureidothiophene-2-carboxylic acid 1 complex. (A) Overall structure of the E. coli RNAP in complex with compound 1. RNAP is depicted as a cartoon model with a partially transparent molecular surface. The compound 1 is shown as a CPK model. The right panel shows a magnified view of the binding site of compound 1 (RNAP switch region). Compound 1 is depicted as a stick model (yellow) and one with 180° rotated orientation (green). The Fo – Fc electron density map (blue mesh) is superposed on the model. (B) Surface representation of the binding pocket of compound 1 with amino acid residues (stick models) participating in the hydrophobic interaction with compound 1 (cyan, β subunit; pink, β′ subunit). Orientation of this panel is the same as in (A). (C) Comparison of the binding of compound 1 (yellow), myxopyronin (magenta; PDB: 4YFX), and squaramide (cyan; PDB: 4FYN) to the RNAP switch region. Orientation of this panel is the same as in (A).
