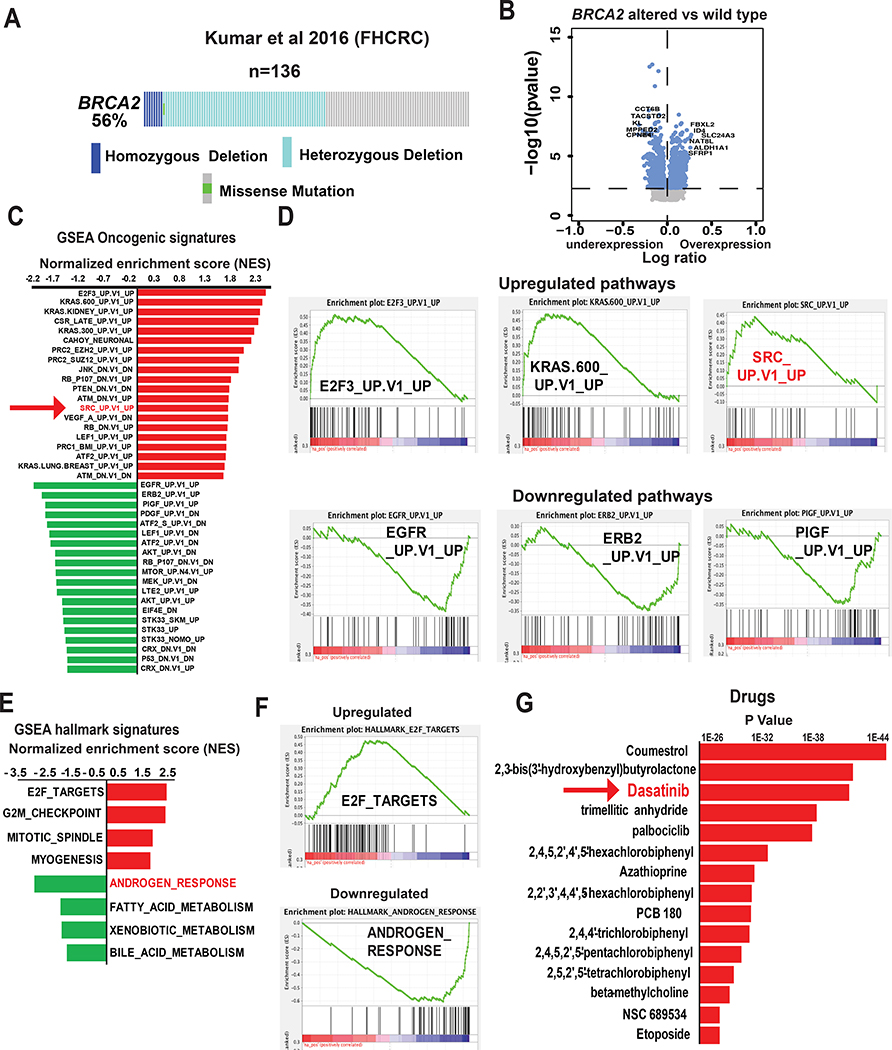
Figure 1. Activation of SRC signaling pathway in BRCA2-deleted prostate cancer.
(A) BRCA2 alteration status of samples in the Kumar et al. 2016 metastatic castration-resistant prostate cancer (mCRPC) cohort. Data from patients with complete mutation and copy number alteration (CNA) information were analyzed (134 samples from 54 patients). (B) Volcano plot shows genes that are altered in BRCA2-deleted (homozygous + heterozygous) compared to samples with wild-type BRCA2. (C) The bar graph shows the oncogenic pathways that are altered in BRCA2-deleted (homozygous + heterozygous) mCRPC tumors in Kumar et al. cohort. Pathway analyses were performed using GSEA (c6 oncogenic signature). The 20 most upregulated and downregulated (based on normalized enrichment score [NES]) pathways are shown. (D) Enrichment plots show the represented oncogenic pathways including upregulation of SRC oncogenic signatures (NES = 1.78, P = 0.003, Q = 0.05). (E, F) The bar graph and enrichment plots represent the hallmark signaling pathways that are significantly altered in BRCA2-deleted (homozygous + heterozygous) mCRPC tumors in the Kumar et al. cohort. Pathway analyses were performed using gene set enrichment analysis (GSEA) (Hallmark signature). (G) The bar graph shows the drugs which are significantly associated with the genes that are upregulated in BRCA2-deleted mCRPC described in Fig 1B. The gene-drug association analysis was performed using Toppgene Suite.

