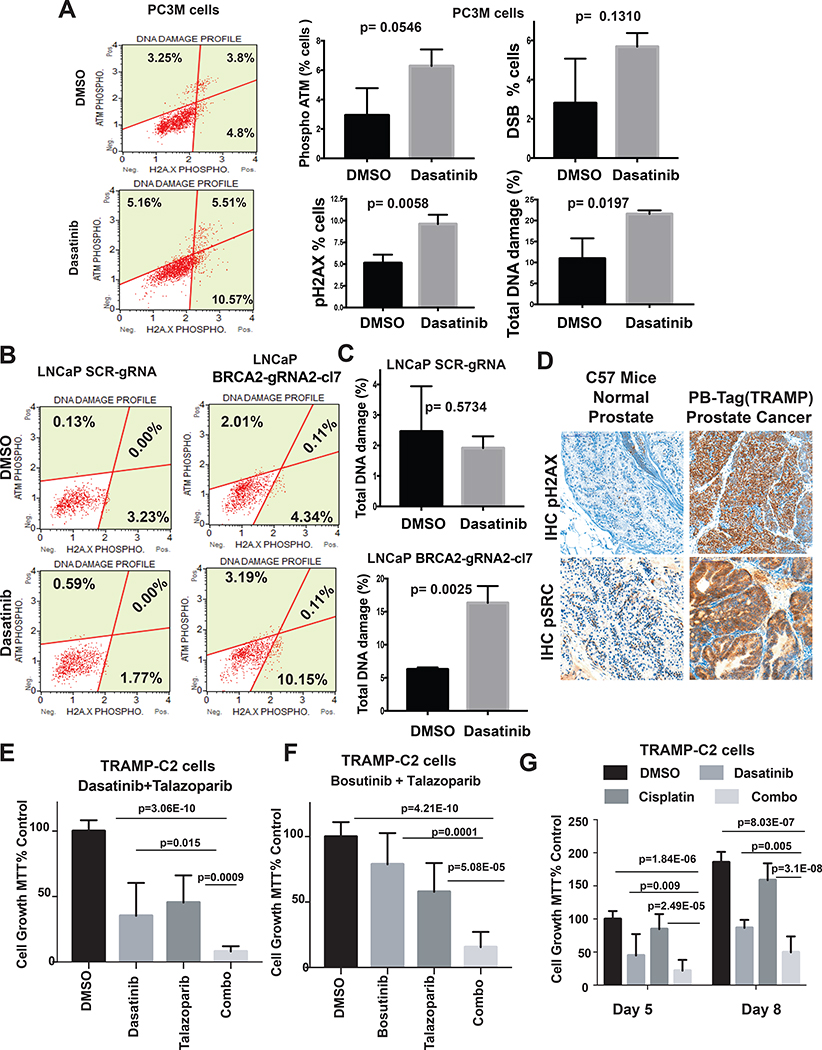
Figure 4. Dasatinib induces DNA damage in BRCA2 null prostate cancer cells.
(A) PC3M cells treated with dasatinib (0.3 μM) for 24 hours. The equivalent volume of DMSO was used as a placebo treatment. Left, dot plots show the percentage of cells with phospho-ATM, phospho-H2A.X, and both phospho-ATM and phospho-H2A.X. Right, bar graphs compare the percentages of cells between DMSO- and dasatinib-treated conditions (± SD). DSB (double-strand break) represents the percentage of cells with dual activation of ATM and H2A.X. Total DNA damage represents the percentage of cells with either activated ATM, activated H2A.X, or dual activation. P values were calculated by Student t-test. (B &C) LNCaP SCR-gRNA and BRCA2-gRNA2 cl7 cells were treated with dasatinib (0.3 μM) for 24 hours. The equivalent volume of DMSO was used as a placebo treatment. Left, dot plots show the percentage of cells with phospho-ATM, phospho-H2A.X, and both phospho-ATM and phospho-H2A.X. Right, total DNA damage represents the percentage of cells with either activated ATM, activated H2A.X, or dual activation. P values were calculated by Student t-test. (D) Representative immunohistochemistry (IHC) images of paraffin-embedded sections of normal prostate from wild-type C57BL/6J mice and localized prostate tumors from PB-Tag mice. Sections were stained immunohistochemically with indicated antibodies (Brown). Nuclei were co-stained with hematoxylin (blue). The micrographs were captured in 200x magnification. Note that prostate tumors of PB-Tag mice exhibit higher DNA damage (increased phosphorylation of γH2AX) and Src activation (Src y416 phosphorylation) compared to normal mice prostate. (E &F) TRAMP-C2 cells (2500 cells/well in 100 μL media) were treated with dasatinib/bosutinib (0.3 μM) and talazoparib (0.03 μM) alone or in combination for 7 days. DMSO was used as a placebo treatment. Cell viability (± SD) was measured by MTT assay. (G) TRAMP-C2 cells were treated with dasatinib (0.3 μM) and cisplatin (0.1 μM; dissolved in DMSF) alone or in combination for 5 and 8 days. The equivalent volume of DMSO was used as a placebo treatment. After indicated number of days, cells were treated with 0.5 mg/mL MTT. The graphs represent the inhibition of cell viability by single and combination treatment. P values were calculated by Student t-test.

