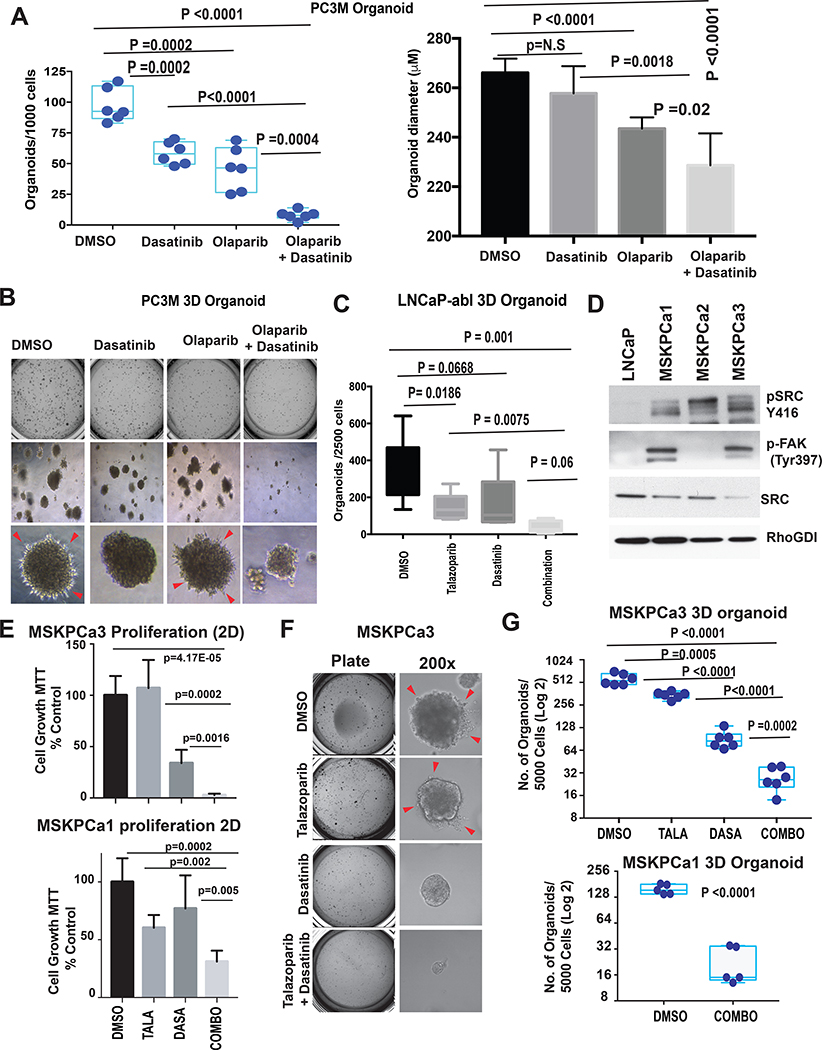
Figure 6. Synergistic effect of dasatinib and PARPi on 3D prostate cancer organoid growth.
(A) PC3M cells (103 cells/well) were mixed with Matrigel, and 3D cell cultures (organoids) were grown in growth factor–enriched media. (See Supplementary Fig. S6A for schematic representation.) The number of 3D organoids (>200 μM diameter, ± SD) is shown. Each point represents the number of organoids (A) and average diameter of PC3M 3D organoids in (B) grown from 103 cells in each well. P value determined by Student’s t-test. (B) Top, images of wells plate at Day 21. Middle, organoids at 40X magnification. Bottom, organoids at 100X magnification. Cells invading through Matrigel are indicated by arrows. (C) Average number of 3D organoids (> 100 μM diameter, ± SD) derived from LNCaP-abl cells (plated at 5×10³ cells/well). P value determined by Student’s t-test. (D) Activation of SRC-FAK pathway in mCRPC-derived organoids (MSKPCa1–3) were analyzed by western blot using indicated antibodies. Lysate from parental LNCaP cells was used as cell line control. RhoGDI was used as loading control (E) Organoids (MSKPCa1 [bottom] and MSKPCa 3 [top]) were counted and plated to collagen-coated (Collagen I 50 μg/ml) 96-well plates (5000 cells/well in 100 μL media) and treated with dasatinib (0.3 μM) and talazoparib (0.03 μM) alone or in combination. The equivalent volume of DMSO was used as a placebo treatment. After 10 days, cells were treated with 0.5 mg/mL MTT. The graphs represent the inhibition of cell viability by single and combination treatment. P values were calculated by Student t-test. (F) MSKPCa3 cells (5× 10³ cells/well) were mixed with Matrigel, and 3D cell cultures (organoids) were grown in growth factor–enriched media and treated with dasatinib (0.3 μM) and talazoparib (0.03 μM) alone or in combination. Left, images of MSKPCa3 cell-derived 3D organoid in 24-well plate at Day 21. Right, organoids at 200X magnification. Cells invading through Matrigel are indicated by arrows. (G) The number of 3D organoids (>150 μM diameter, ± SD) derived from MSKPCa3 (top) and MSKPCa1 (bottom) are shown. Each point represents the number of organoids grown from 5×10³ cells in each well of 24-well plate (after 4 weeks of plating the cells). P value determined by Student’s t-test.

